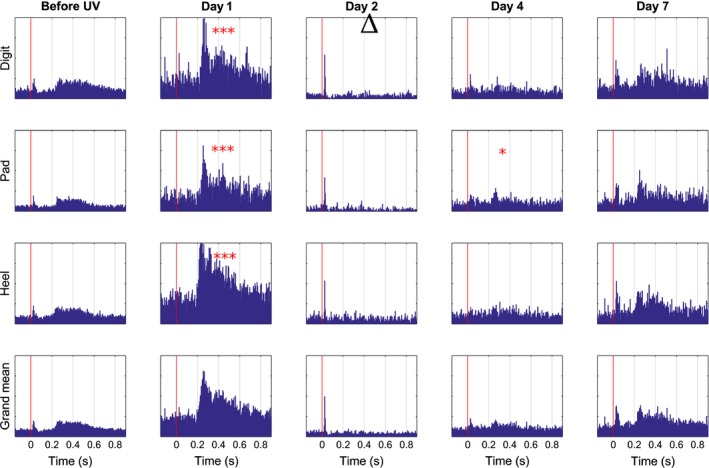
Figure 2.

Mean time course of changes in unit activity of neurons in SI cortex upon CO 2 laser stimulation following UVB irradiation of the hind paw skin. Time progression from left to right; panels to the left represent control conditions before UVB irradiation (but after surgery and implantation, cf. Figs. 4‐6), dashed line indicates UVB irradiation, panels to the right of dashed line depict consecutive test occasions over a period of 1 week postirradiation (Days indicated on top). Peristimulus time histograms upon neuronal responses to stimulation of sites 1–9 (Digit cf. Fig. 1), sites 10–13 and 19 (Pad), sites 14–18 and 20 (Heel). For each of the 20 sites 20 stimulations were given per day and animal. The data from all sites belonging to a given area was pooled. Bottom row shows a grand mean of all three groups. X‐axis in individual diagrams denotes time in seconds and the y‐axis depicts amplitude (μV). Red vertical line indicates time of stimulation. *p < 0.05, ***p < 0.001significant increase and ▵ <0.05 significant decrease.
