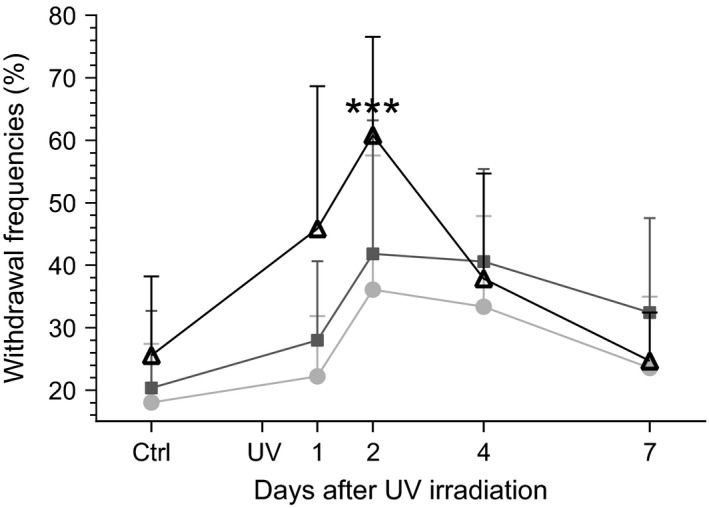
Figure 5.

Time course of changes in frequency of withdrawal responses to CO 2 laser stimulation following UVB irradiation of the hind paw skin. Mean and SEM of percentages of withdrawal responses upon CO 2 laser stimulation within the Heel (open triangles), Pad (dark grey squares) and Digit (light grey circles) areas of the hind paw (cf. Fig. 1) are plotted; time scale after UVB irradiation is linear. The control (Ctrl) value before UVB irradiation (UV) represents a mean of 11 test occasions performed postsurgery (cf. Supporting Information Fig. S1). ***p < 0.001; one‐way anova followed by Bonferroni's multiple comparison test (entry f) in Supporting Information Table S1).
