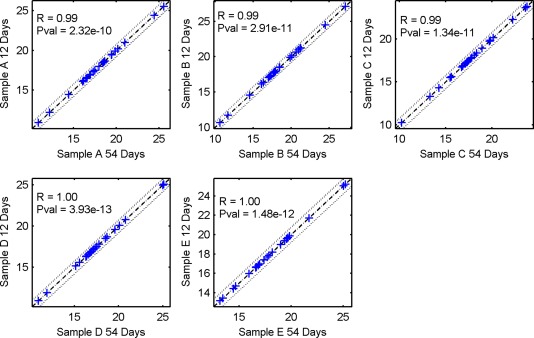
Figure 3.

The correlation in expression profiles of recent and older samples. Expression profiles for 5 recently prepared slides that were cut in half are illustrated. One half of each slide was processed immediately, and the other half was stored at room temperature for 54 days and then processed. Each blue cross represents the expression level of a single microRNA (miRNA) measured by the assay. The x‐axis represents slide halves that had a longer time to processing, and the y‐axis represents recently processed slide halves. Dashed lines represent a 1.5‐fold change in expression. In order to visualize the differential expression of miRNAs, inverted cycle threshold (CT) values are shown: The CT values were subtracted from 50, so that high values represent high expression. These charts indicate that expression levels were identical in both halves of each slide. Pval indicates P value; R, correlation coefficient.
