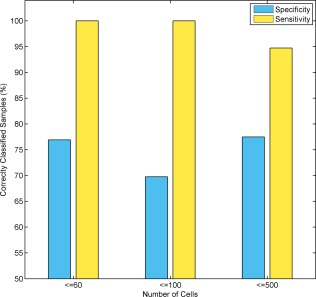
Figure 5.

Assay performance on samples that had various amounts of thyroid cells. The assay's performance was tested on a set of 106 samples in which the number of thyroid cells ranged from 30 to 500 (as evaluated by the referring cytologists). The assay sensitivity and specificity are described for samples in which the number of thyroid cells was ≤60 (n = 36), ≤100 (n = 64), and ≤500 (n = 106). The y‐axis represents sensitivity and specificity values. The x‐axis represents the cumulative number of cells. Within the range tested, assay sensitivity and specificity were not affected by the number of thyroid cells on the slide.
