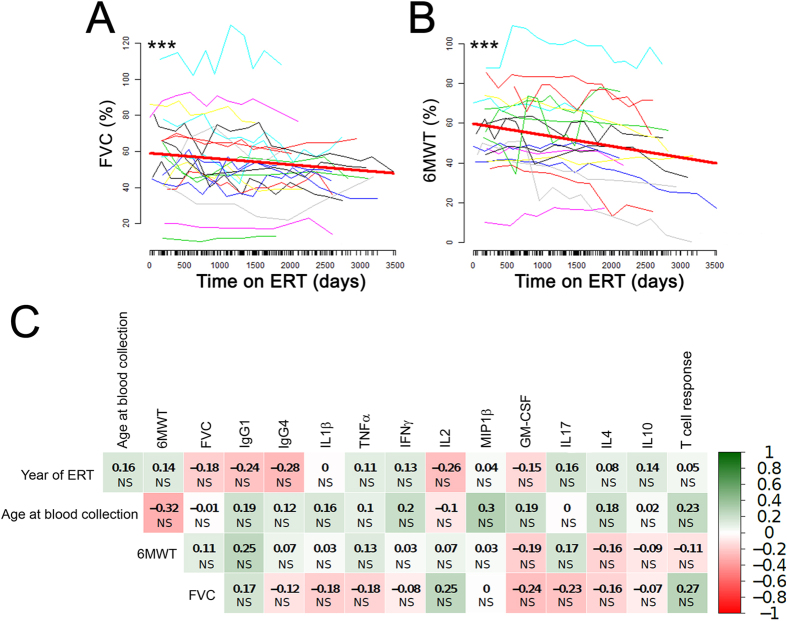
Figure 6. Clinical outcome measures and statistical analysis of results.
(A) % forced vital capacity (FVC) measurements, expressed as % predicted in healthy individuals, over a period of 4 years in 21 treated LOPD subjects; the red line represents the average evolution of the measurement. The estimated slope is −1.16% per year; the estimated intercept is 58.9%; p value is given by linear mixed models (see Methods). The following equations were used to calculate the % FVC: [FVC predicted for males = 0.060 * height − 0,0214 * age – 4.65]; [FVC predicted for females = 0.0491 * height − 0.0216 * age – 3.59]; [FVC (%) = FVC observed/FVC predicted * 100] (B) Six-minute walk test (6MWT), expressed as % predicted in healthy individuals, measured over a period of 4 years in 19 subjects, the red line represents the average evolution of the measurement. The estimated slope is −2.06% per year; the estimated intercept is 59.6%; p value is given by linear mixed models (see Methods) (***P < 0.001). The following equations were used to calculate the % 6MWT: [6MWT predicted for males = −309–5.02 * age − 1.76 * weight + 7.57 * height]; [6MWT predicted for females = 667–5.78 * age − 2.29 * weight + 2.11 * height]; [6MWT (%) = 6MWT observed/6MWT predicted * 100]. (C) Spearman correlation of measurements of immune responses to rhGAA with clinical outcome measures recorded at the time of blood collection. The numbers in the table represent the correlation coefficient between two variables with the relative p value (t-test) (NS, not significant).

