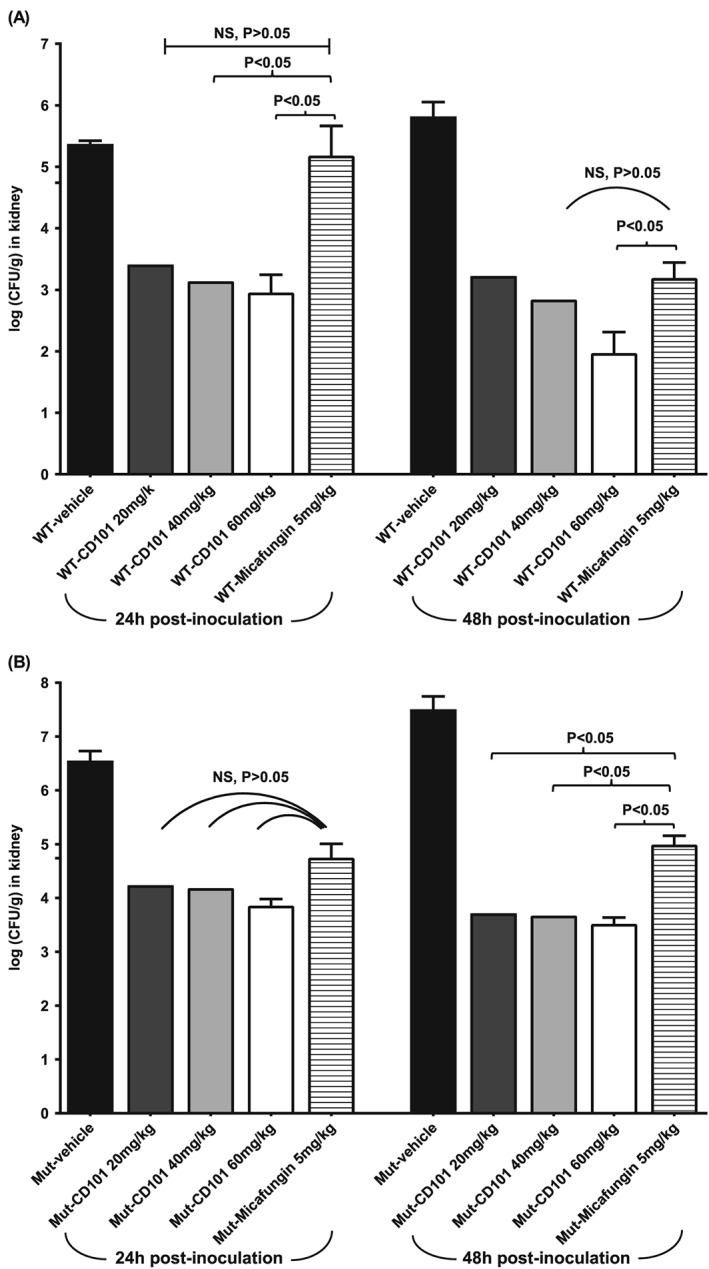
Figure 3.

Kidney burden comparison among different treatment groups of mice infected with (A) C. albicans WT strain ATCC 90028 or
(B) C. albicans mutant strain DPL22 S645P/S at 24 h and 48 h post‐infection. Each bar represents the mean burden in the kidneys from five mice. The error bars represent standard deviations.
