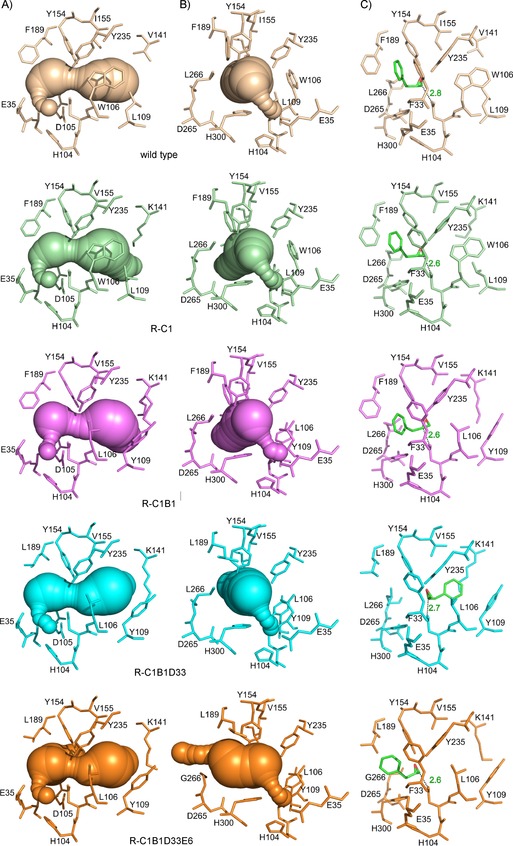
Figure 2.

A) Side view (active‐site entrance on right), B) axial view, and C) preferred docking poses of (S)‐1 of wild‐type and variants. Volumes in the crystal structures were calculated with Caver12 (v. 3.01;0.9 Å radius probe). Catalytic residues and those altered by laboratory evolution are shown in stick representation. Water molecules are omitted for clarity. Distances are in ångström, and are drawn between the closest epoxide carbon and D105 Oδ. Images were generated in PyMol (v. 1.8.1; www.pymol.org).
