
Figure 1.
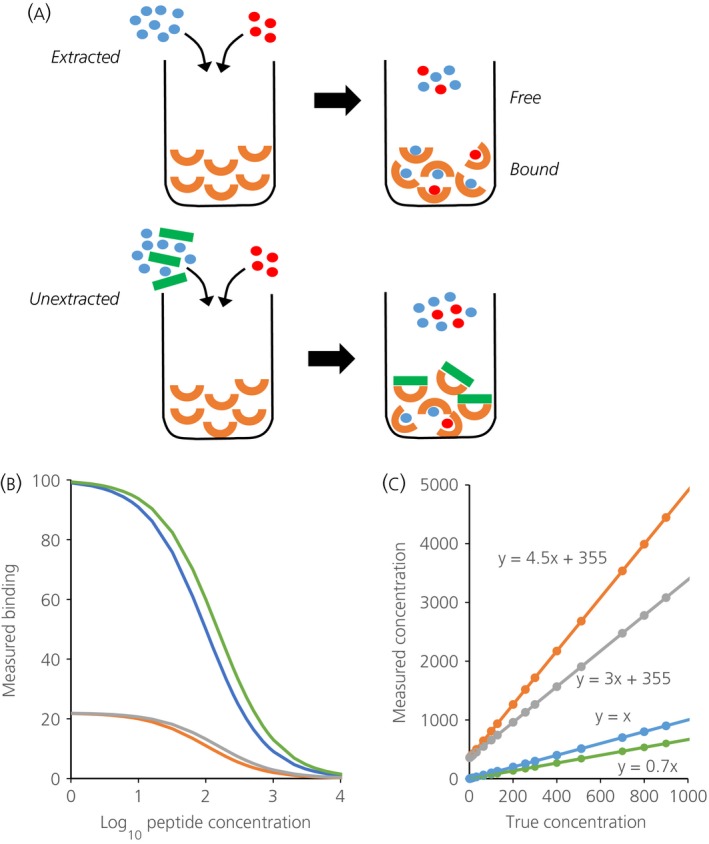
(a) Illustrates the principles underlying competitive immunoassays and the problem posed by plasma matrix interference. In an immunoassay, a sample containing an unknown amount of hormone (in blue) is mixed with a known amount of labelled hormone (red) and introduced to a given amount of antibody (orange). The labelled and unlabelled hormone compete for binding to the antibody: the more hormone in the sample, the less bound labelled hormone, which is what is measured in an immunoassay. Unextracted plasma contains large molecules that can bind nonspecifically to antibodies (green), preventing them from binding to antigen. Accordingly, less labelled hormone can bind to the antibody, and this is erroneously measured as an excess of hormone in the sample. When a ligand L interacts with antibody M to form a complex ML, the concentrations at equilibrium are governed by Kd = [M]*[L]/[ML] where Kd, the dissociation constant, characterises the affinity of the antibody. Defining Mo = [M] + [ML] as the maximum binding, the relationship [ML] = M0*[L]/(Kd + [L]) determines the hyperbolic standard curve 78. By this relationship, in a radioimmunoassay, the log of the concentration of unlabelled peptide is linearly proportional to logit (B/Bo) where B is the counts measured ([M]), B0 is the maximum number of counts measured in the absence of unlabelled peptide ([M0]), and logit (y) = loge(y/(1 − y)). (b) Illustrating (in blue) the relationship between log peptide concentration and B when B0 and Kd are given values of 100. Samples are contained not in assay buffer but in a sample matrix that can affect either Bo or Kd. If the matrix reduces the affinity of the antibody, the true concentrations of ligand will relate to measured levels by a curve that is displaced to the right of the standard curve: the green curve in (b) simulates the effect of changing Kd from 100 to 150. In an immunoassay, this leads to an underestimation of levels, as shown by the green line in (c), which plots the true concentration against that inferred from the standard curve. If the matrix reduces the antibody available for binding with the ligand, the true concentrations will relate to measured levels by a curve that is ‘compressed’. The orange curve in (b) simulates the effect of interference that changes Bo from 100 to 22; such an assay will report an erroneous high basal level (360 pg/ml) and will exaggerate the levels of any ligand present, by 4.5‐fold in the example shown by the green line in (c). Plasma proteins may affect both Kd and Bo. The grey curves in (b) and (c) show the effects of increasing Kd to 150 and reducing B0 to 22. The erroneous baseline level is unaffected, but the exaggeration is reduced; here, the gain is three‐fold.