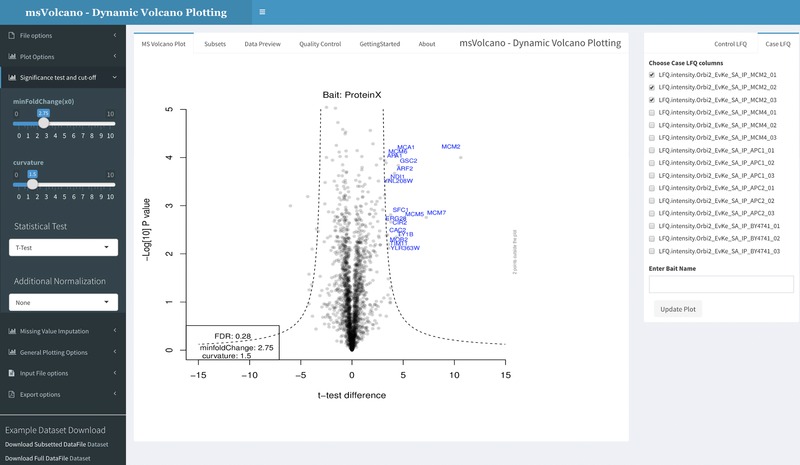
Figure 1.

Interface is divided into three sections, sidebar, body panel and column selection panel (left to right). Sidebar provides an access to the file upload, plot aesthetics, cutoff parameters, missing data imputation13, stoichiometry and the export options. The body panel has six different tabs, where the default panel labeled as “MS Volcano Plot”' displays the volcano plot. Second tab, “Subsets” displays the filtered input data for the significant interactors. “Data Preview” tab displays the user‐defined data for scrutiny. “Quality Control” tab displays a series of overlayed histograms, scatter and QQ plots helpful in assessing the correlation between the replicates, examining the distribution of the missing values and the behavior of imputed value population. “GettingStarted” and “About” tab display the specific and general information about the web interface. When user uploads a file or enters an ftp link, all LFQ columns are scanned and displayed in the column selection tab on the right side. User now selects respective bait and control columns (minimum two) and optionally enters the name of bait in the provided text box. As the “Update Plot” button is pressed, the plot is generated simultaneously.
