
Figure 4.
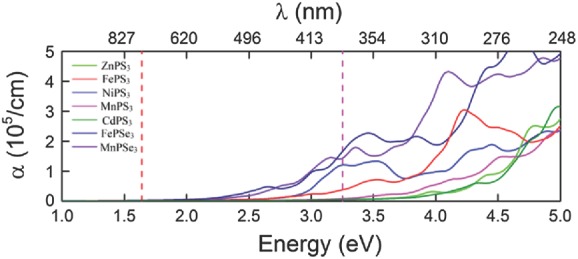
Optical absorption coefficient α for MPS3 (M = Fe, Mn, Ni, Cd, Zn) and MPSe3 (M = Fe, Mn). The area between the red and the purple lines represents the visible range.
Official websites use .gov
A
.gov website belongs to an official
government organization in the United States.
Secure .gov websites use HTTPS
A lock (
) or https:// means you've safely
connected to the .gov website. Share sensitive
information only on official, secure websites.
Optical absorption coefficient α for MPS3 (M = Fe, Mn, Ni, Cd, Zn) and MPSe3 (M = Fe, Mn). The area between the red and the purple lines represents the visible range.