Figure 6.

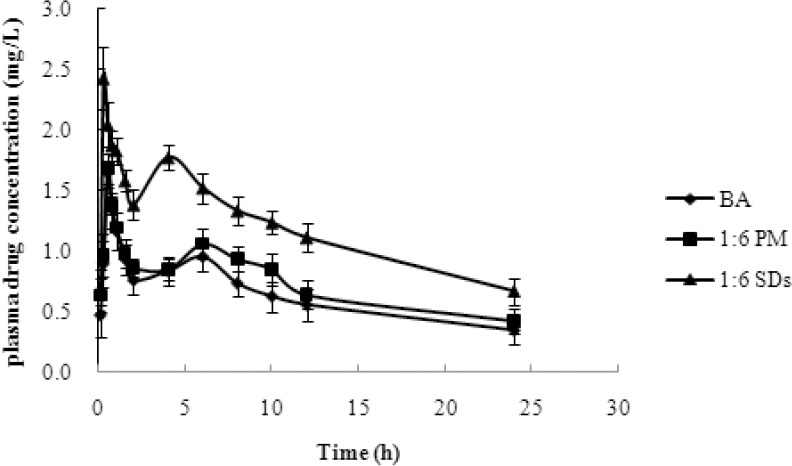
The plasma concentration–time profile of BA after oral administration of BA, PMs and SDs to rats, at a dose of 100 mg/kg. The data are presented as mean ± standard deviation (n = 6).

The plasma concentration–time profile of BA after oral administration of BA, PMs and SDs to rats, at a dose of 100 mg/kg. The data are presented as mean ± standard deviation (n = 6).