
Fig. 3.
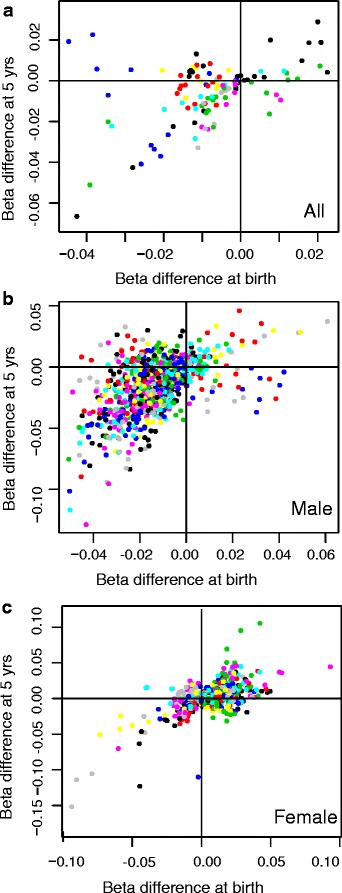
DNA methylation differences between treatment groups for probes within significant differentially methylated regions (DMRs). The differences in beta values between the DHA and the control group at birth and age 5 years are shown for probes that are part of significant DMRs between the DHA and control group at birth. DNA methylation differences are shown for all children (a) and males (b) and females (c) separately. The probes are coloured by DMR; DMR1 (ESYT3) in black in the lower left corner, DMR2 (chr12) in blue in the lower left corner, DMR12 (chr12) in blue in the upper left corner