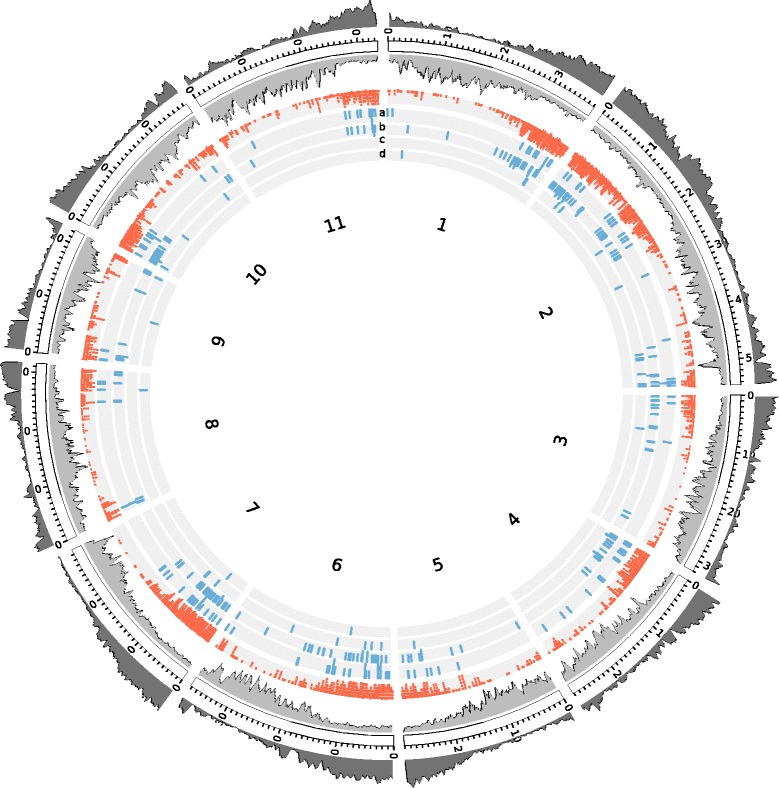
Fig. 1.

Distribution of DArTseq-derived SNP markers in the C. canephora genome. Graphical representation of the eleven pseudo-molecules of C. canephora showing the density of genes (dark gray) and transposable elements (light gray), along with the location of the 4,021 DArTseq SNP markers used for the analysis (red). Markers with the highest contribution (blue) to the first (a), second (b), third (c) and fourth (d) discriminant axes deciphering the genetic structure of C. canephora are also shown
