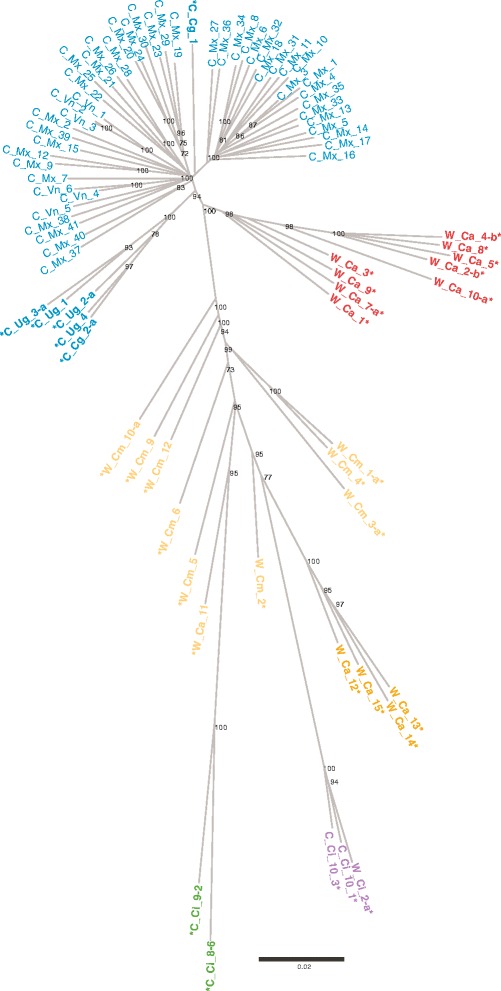
Fig. 4.

Neighbor Joining tree based on SNP marker evaluations. Unrooted tree using the Neighbor-joining algorithm based on Nei’s genetic distances between 81 individuals of C. canephora. Accessions marked with an (*) are active individuals used in the DAPC analysis to determine the genetic groups. The color patterns are equivalent to the barplots in Figs. 2 and 3, where blue represents cultivated individuals from Congo, Uganda, Vietnam and Mexico, known to belong to the Robusta Congo – Uganda group; Orange and yellow represent the accessions previously described into the Nana group, from Cameroon and the Central African Republic; Green is equivalent to the Conilon group; purple represents wild and cultivated Guinean accessions collected in the Ivory Coast; and finally, red represents wild individuals from the Central African Republic belonging to the Robusta Congo-Central Africa group. For clarity’s sake only bootstrap values over 70 are exposed
