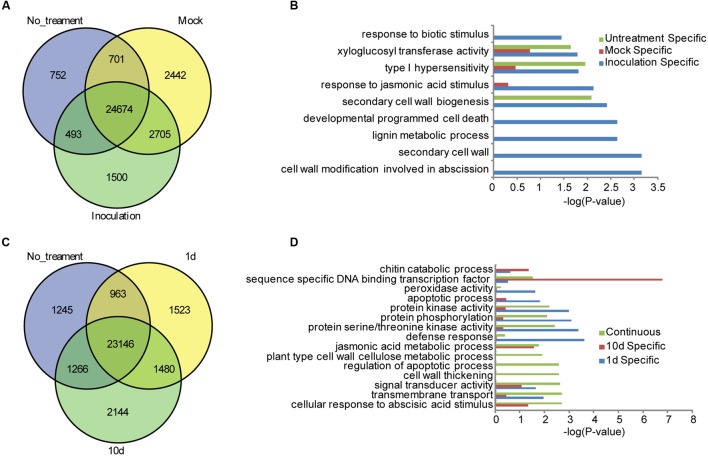
FIGURE 1.
Specifically expressed genes in the different tested samples of BT-1. (A) Venn diagrams of expressed genes in no-treatment (No_treatment), water (Mock) and F. verticillioides-inoculated (Inoculation) test samples. (B) Enriched GO terms in the Biological Process category that are associated with the specifically expressed genes in no-treatment (Untreatment Specific), water (Mock Specific) and F. verticillioides-inoculated (Inoculation Specific) test samples. Abscissae represent GO enrichment -LOG10 FDR values. (C) Venn diagrams of expressed genes in no-treatment (No_treatment), 1 day post inoculation (1d) and 10 days post inoculation (10d) test samples. (D) Enriched GO terms in the Biological Process category that are associated with the specifically expressed genes in F. verticillioides-inoculated (Inoculation Specific) test samples. Genes specifically expressed in 1 day post inoculation (1d), 10 days post inoculation (10d) test samples and genes expressed in the two samples (Continuous) were enriched respectively. Abscissae represent GO enrichment -LOG10 FDR values.

