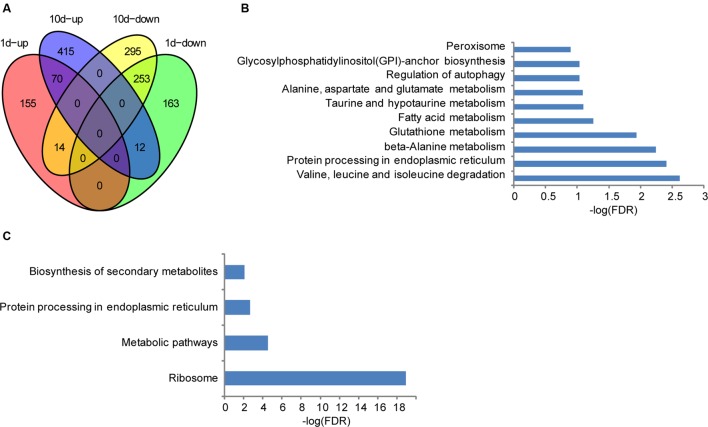
FIGURE 2.
Differentially expressed genes in different seed development stages of BT-1. (A) Venn diagrams of differentially expressed genes in water treatment samples (vs. no treatment samples). 1d-up: the genes up-regulated in 1d post treat. 1d-down: the genes down-regulated in 1d post treat. 10d-up: the genes up-regulated in 10d post treat. 10d-down: the genes down-regulated in 10d post treat. (B) Enriched pathways that are associated with the differentially expressed genes in 1 day post water treatment samples. Abscissae represent KEGG Pathway enrichment -LOG10 FDR values. (C) Enriched pathways that are associated with the differentially expressed genes in 10 days post water treatment samples. Abscissae represent KEGG Pathway enrichment -LOG10 FDR values.

