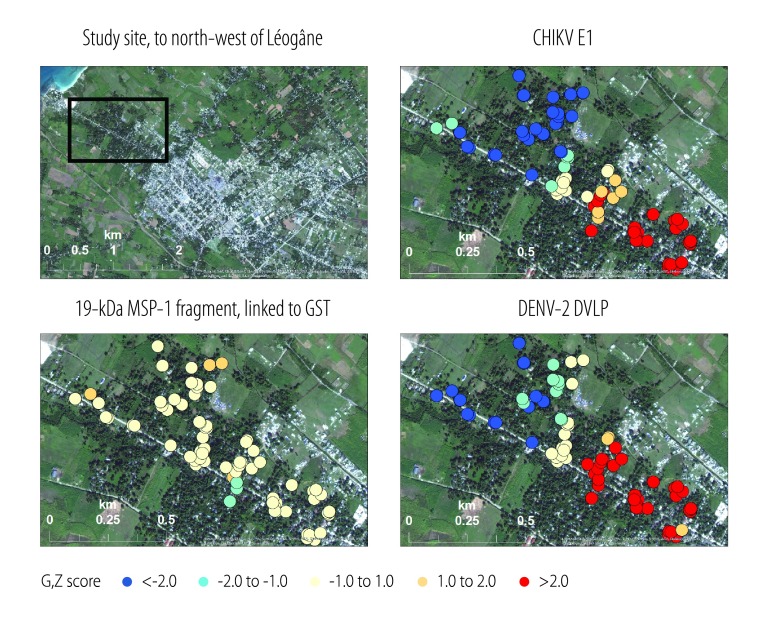
Fig. 5.
Spatial analysis of fluorescence intensities recorded in multiplex bead assays based on antigens representing chikungunya and dengue viruses and Plasmodium falciparum, Haiti, 2014
CHIKV E1: chikungunya virus envelope 1; DVLP: dengue virus-like particle; GST: glutathione-S-transferase; MSP-1: merozoite surface protein 1.
Notes: The assays were used, with three test antigens, to investigate blood spots from a cross-sectional sample of 127 children. In the spatial analysis of the data, Z scores for the Getis–Ord Gi statistic were aggregated and displaced from their actual locations. Blue and red circles indicate, respectively, so called low spots and high spots – i.e. clusters where children had immunoglobulin G responses to the test antigen that were significantly lower and higher, respectively, than the mean value.

