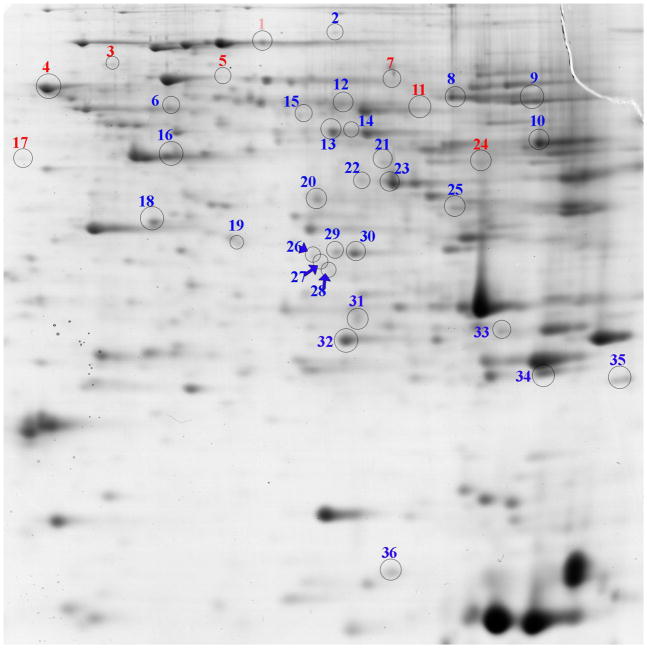
Figure 1. Liver proteome profiles of 6 month old offspring previously developmentally exposed to cigarette smoke.
The proteins with altered abundance that contributed to the separation of the groups within the PLS-DA model and possessed the highest VIP values (≥1.75) are numbered. Numbers in blue represent increased abundance and the numbers in red represent decreased abundance. The gel image is highly contrasted to enable visualization of low abundant protein spots. Refer to Table 2 for protein identifications.

