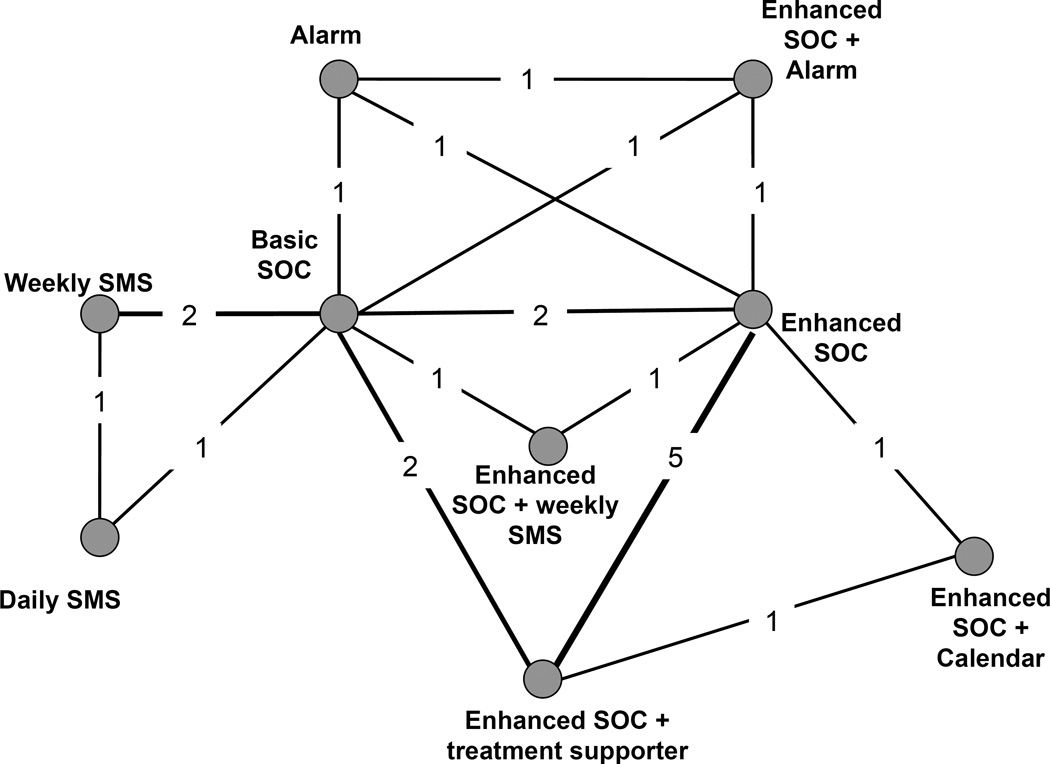
Figure 2.
Network diagram for randomized clinical trials evaluating interventions seeking to improve ART adherence among HIV-positive patients
Legend. Nodes represent the individual or combined interventions. Lines between the nodes represent where direct (head-to-head) RCTs have been conducted. The numbers within those lines indicate the number of RCTs that have been conducted.

