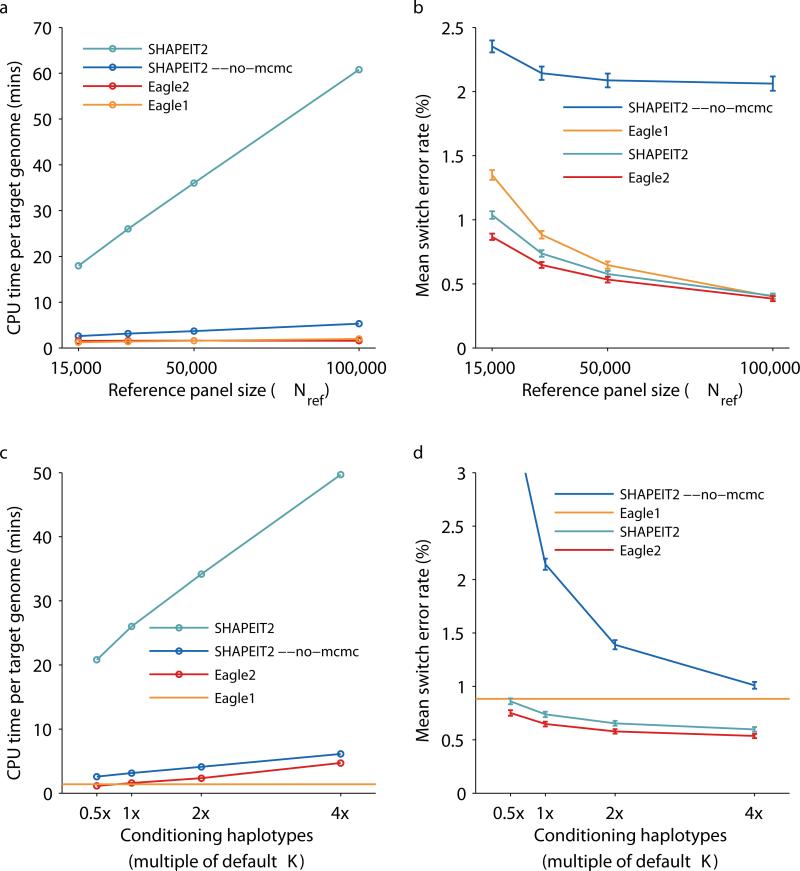
Figure 2. Running time and accuracy of reference-based phasing in UK Biobank benchmarks.
We benchmarked Eagle2 and other available methods by phasing UK Biobank trio children using a reference panel generated from Nref = 15,000, 30,000, 50,000, or 100,000 other UK Biobank samples. (a) CPU time per target genome on a 2.27 GHz Intel Xeon L5640 processor. (We analyzed a total of 174,595 markers on chromosomes 1, 5, 10, 15, and 20, representing ≈25% of the genome, and scaled up running times by a factor of 4; see Supplementary Table 3 for details.) (b) Mean switch error rate over 70 European-ancestry trios; error bars, s.e.m. (c, d) CPU time and mean switch error rate as a function of the number of conditioning haplotypes used by SHAPEIT2 and Eagle2 (relative to the default values of K=100 and 10,000, respectively). Eagle1 does not have such a parameter, so we display its performance as a horizontal line. Numeric data and additional benchmarks varying the number of conditioning haplotypes used with Nref = 15,000, 50,000, and 100,000 are provided in Supplementary Table 2.

