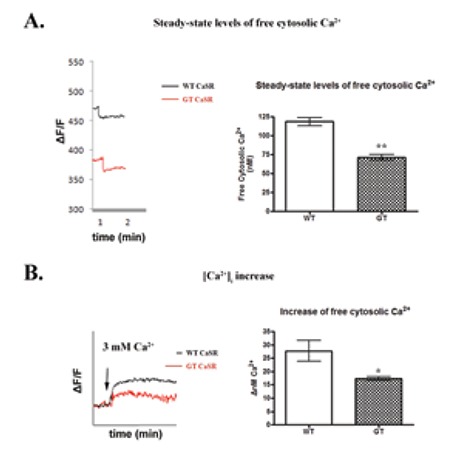
Figure 2. Alterations of Ca2+-evoked responses in the presence of CaSR mutation: (A) Steady-state levels of free cytosolic Ca2+. Representative Ca2+ traces are shown in the left panel and quantitative analysis of the (Ca2+)i is depicted on the right panel. n=3; **p<0.01, comparing between wild-type and GT, using unpaired t-test. (B) Ca2+ influx upon stimulation with CaCl2. Representative Ca2+ measurements are shown in the left panel and quantitative estimation of (Ca2+)i increase (ΔnM), upon CaCl2 stimulation is depicted on the right panel. n=3; *p<0.05, comparing between wild-type and GT using unpaired t-test. WT: wild-type.

