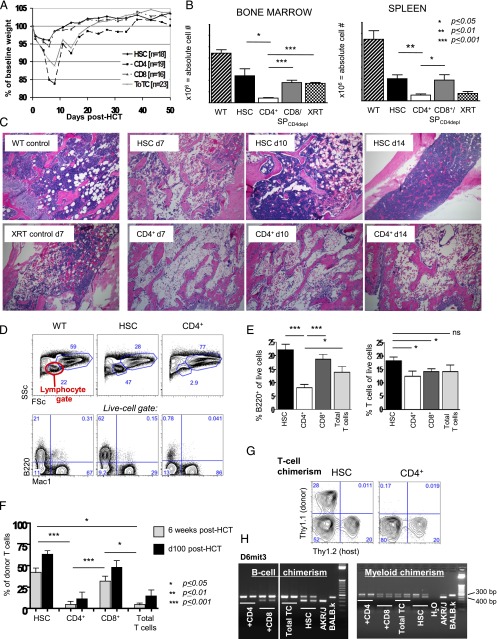
FIGURE 1.
Donor CD4+ T cells cause BM aplasia and engraftment failure. Experimental schema: BALB.K (H2k) or BALB.B (H2b) mice underwent sublethal 400 cGy TBI and were infused with 3000 AKR/J (H2k) or C57BL/6 (H2b) KTLS-HSC (c-Kit+Thy1.1loLinnegSca-1+), respectively. HSCs were given alone or in combination with CD4+, CD8+, or CD4++CD8+ (total) T cells. (A) Weight course of BALB.K mice that underwent 400 cGy TBI and were infused with 3000 AKR/J HSCs (n = 16), HSC+CD4+ (n = 19), HSC+CD8+ (n = 19), or HSC+total T cells (n = 23). The weight curves (showing % of baseline weight) indicate a marked weight loss but rapid and complete recovery in mice given HSC+CD4+ or HSC+total T cell grafts. Recipients of HSCs alone or HSC+CD8+ had only minimal weight loss and recovered promptly. (B) Absolute cell counts from day 14 show significantly reduced cellularity in BM (left) and spleen (right) in recipients of HSC+CD4+ (n = 11) compared with recipients of HSCs alone (n = 8), HSC+CD8+ or HSC+CD4-depleted (CD4depl) splenocytes (n = 6) or XRT controls (n = 6). (C) H&E staining of long bones of representative transplanted animals on days 7, 10, and 14 post-HCT, an XRT control on day 7, and a WT animal are shown. Original magnification ×10. (D) FACS analysis of blood at day 28 post-HCT showed marked reduction of cells in the lymphocyte gate in HSC+CD4+ recipients (side scatter [SSC] low/forward scatter [FSC] low, top panel). This lymphopenia resulted primarily from a marked reduction of B cells (lower panel of FACS plots). (E) Compiled bar graphs displaying proportions of B220+ B cells and T cells of all live cells at 4 wk post-HCT. (F) Compiled FACS results displaying donor T cell (Thy1.1) contribution to all live cells at 6 wk (d42) and day +100 post-HCT showing the lowest donor T cell contribution in recipients of CD4+ T cell–containing grafts. (G) Representative d42 FACS plots of blood measuring Thy1.1+ donor versus Thy1.2+ host T cells of HSC and HSC+CD4+ recipients. (H) d42 blood B cell (sorted for B220+ cells) and myeloid (sorted for Mac1+ cells) chimerism assessed by PCR for D6mit3 revealed absence of donor B cells in HSC+CD4+ or HSC+total T cell recipients, and mixed donor-host B cell chimerism in recipients of HSC alone or with CD8+. In contrast, myeloid cells were of mixed chimerism in all groups. Two representative examples per group are shown. *p ≤ 0.05, **p ≤ 0.01, ***p ≤ 0.001.

