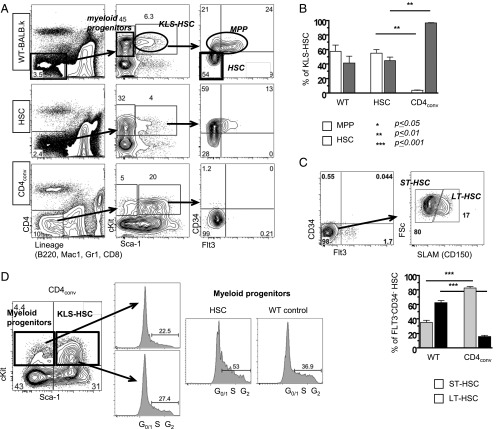
FIGURE 5.
CD4+ T cell–mediated inflammation prevents HSC proliferation and maturation. (A) Gating schema used to delineate HSC and progenitor subsets. Shown are representative FACS plots for KLS-HSCs and MPPs for WT (top panels), HSC recipients (middle panels), and HSC+CD4conv recipients at day 14 post-HCT. Myeloid progenitors: c-Kit+Sca-1−; KLS-HSC: c-Kit+Sca-1+ which comprise MPPs (CD34+Flt3+/−) and true-HSC (CD34−Flt3−). HSC recipients showed normal proportions of myeloid progenitor cells and KLS-HSCs, with increase of MPPs (middle panels). HSC+CD4 conv recipients had decreased myeloid progenitor cells but increased proportions of KLS-HSCs (mostly CD34−Flt3−; bottom panels). (B) Compiled data of % MPPs and HSCs within KLS-HSCs of WT mice (n = 5), HSC recipients (n = 4), and HSC+CD4conv recipients (n = 9). (C) Top panels are representative FACS-HSC staining in the BM of a HSC+CD4+ recipient displaying the gating schema to delineate SLAM+ LT-HSCs and SLAM− ST-HSCs within the KLS-Flt3−CD34− HSC compartment. Bottom panel represents compiled data on proportions of LT-HSCs and ST-HSCs within the KLS-Flt3−CD34− HSC compartment in HSC+CD4conv recipients (n = 5) and WT mice (n = 4). (D) FACS cell cycle analysis of myeloid progenitors and KLS-HSCs was performed with G0/1 indicating resting stage, and S and G2 indicating synthesis phase. On day 7 post-HCT, Linneg-gated BM cells of HSC+CD4+ recipients had decreased myeloid progenitors and increased KLS-HSCs compared with WT control and HSC recipients, and myeloid progenitor cells in HSC recipients and WT mice had a greater proportion of cells in the S-synthesis phase. Shown are FACS plots of representative animals with groups of n = 2–4 animals per group. **p ≤ 0.01, ***p ≤ 0.001.

