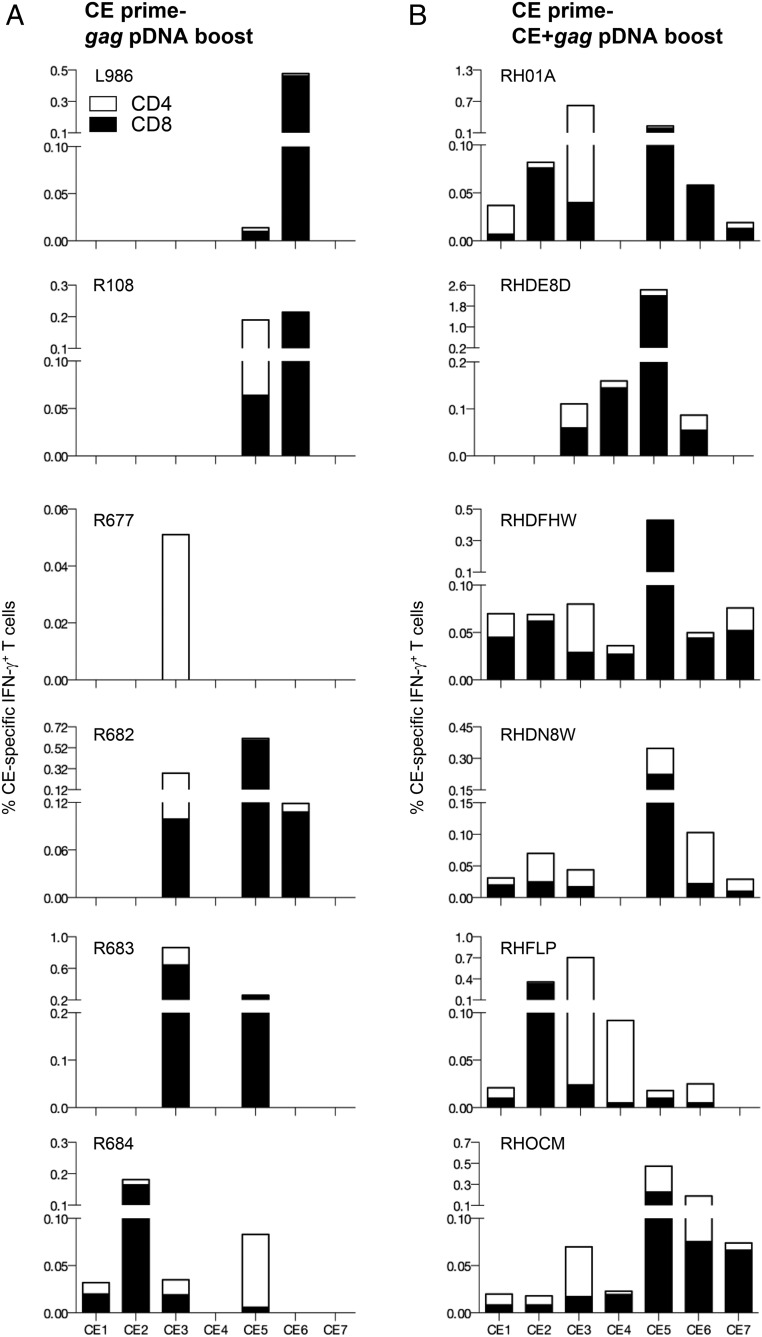
FIGURE 6.
Mapping of responses to individual CE in macaques vaccinated with two different prime-boost vaccine regimens. Comparison of the responses to individual CE in macaques that received CE prime followed by either gag pDNA or p27CE+gag pDNA booster vaccination. PBMC were stimulated using peptide pools covering each individual CE (CE1–CE7). The percentages of IFN-γ+ CD4+ (open bars) and CD8+ (filled bars) T cells specific each individual CE 2 wk after the last vaccination are shown. (A) Mapping of the animals boosted with gag pDNA shows a response range of one to four CE (median two CE per animal; Table II). (B) Mapping of the animals boosted with the codelivery of p27CE+gag pDNA shows a response range of four to seven CE (median six CE per animal; Table II).

