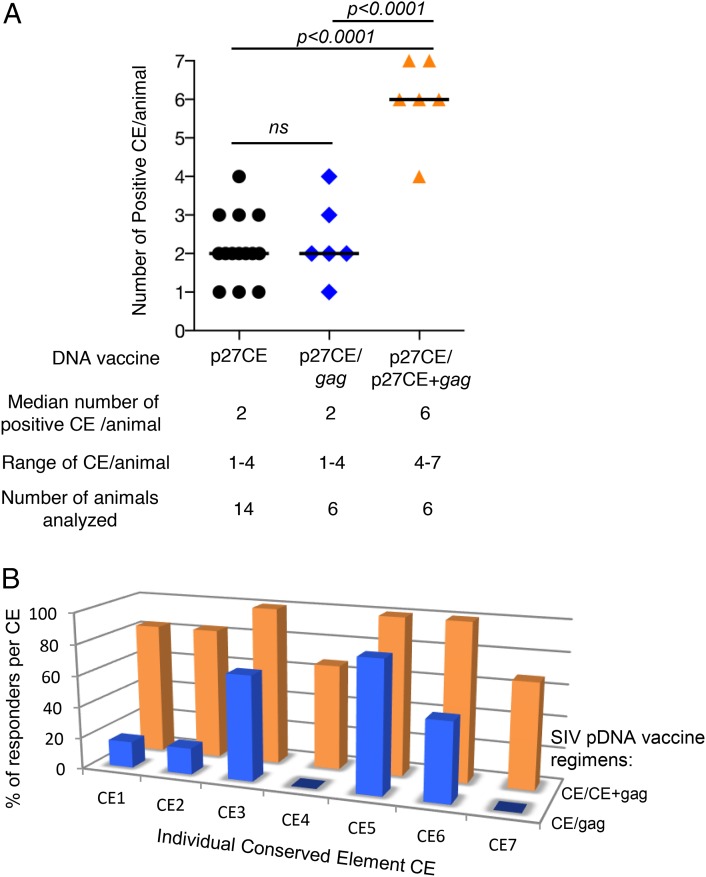
FIGURE 7.
Comparison of CE response breadth induced by the different SIV p27CE pDNA vaccine regimens. (A) The plot shows the number of CE recognized by each macaque immunized with the different p27CE pDNA vaccine regimens: p27CE pDNA only, or prime-boost regimens including gag pDNA and p27CE+gag pDNA booster vaccinations. The median number of recognized CE, the range of CE responses, and the number of analyzed animals are indicated. The p values are from ANOVA (Dunnett’s test). (B) Comparison of the breadth of the responses induced by the CE prime/gag pDNA prime-boost (blue) and CE prime/CE+gag pDNA prime-boost (orange) vaccine regimen. The bars show the percentage of the vaccinated animals recognizing each specific CE.

