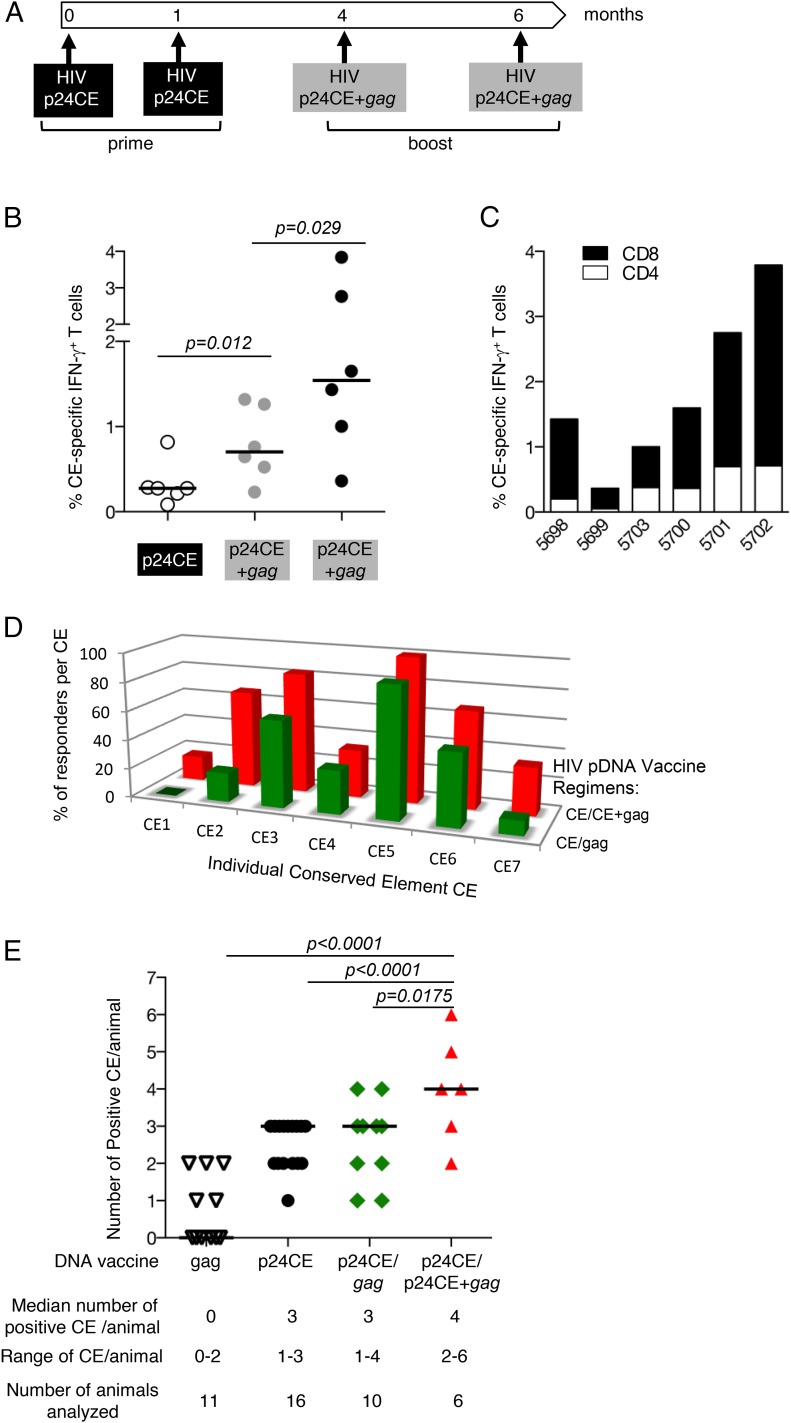
FIGURE 9.
Increased breadth of HIV CE using codelivery of CE+gag pDNA booster vaccination regimen. (A) The cartoon depicts the HIV CE pDNA prime/CE+gag pDNA booster vaccination regimen. Cellular immune responses were measured 2 wk after each vaccination. (B) The frequency of the HIV CE-specific IFN-γ+ T cell responses was measured after CE pDNA prime and after each CE+gag pDNA boost. The p values are from ANOVA. (C) The frequency of HIV CE-specific IFN-γ+ T cell responses is shown for CD4+ (open bars) and CD8+ (filled bars) T cells after the second CE+gag pDNA booster vaccination. (D) Comparison of the response breadth induced by the CE prime/gag pDNA prime-boost [data reported in Kulkarni et al. (21)] (green) and CE prime/CE+gag pDNA prime-boost (red). The bars show the percentage of the vaccinated animals recognizing each specific CE. (E) Plot shows the number of CE recognized by each macaque immunized with HIV CE pDNA prime/CE+gag pDNA booster vaccination. The median number CE recognized, range of CE responses, and number of animals analyzed are indicated. The data for animals that received HIV CE pDNA only, HIV CE prime/gag pDNA booster vaccination or HIV gag pDNA were reported previously (21). The p values are from ANOVA (Dunnett’s test).

