
Fig. 2.
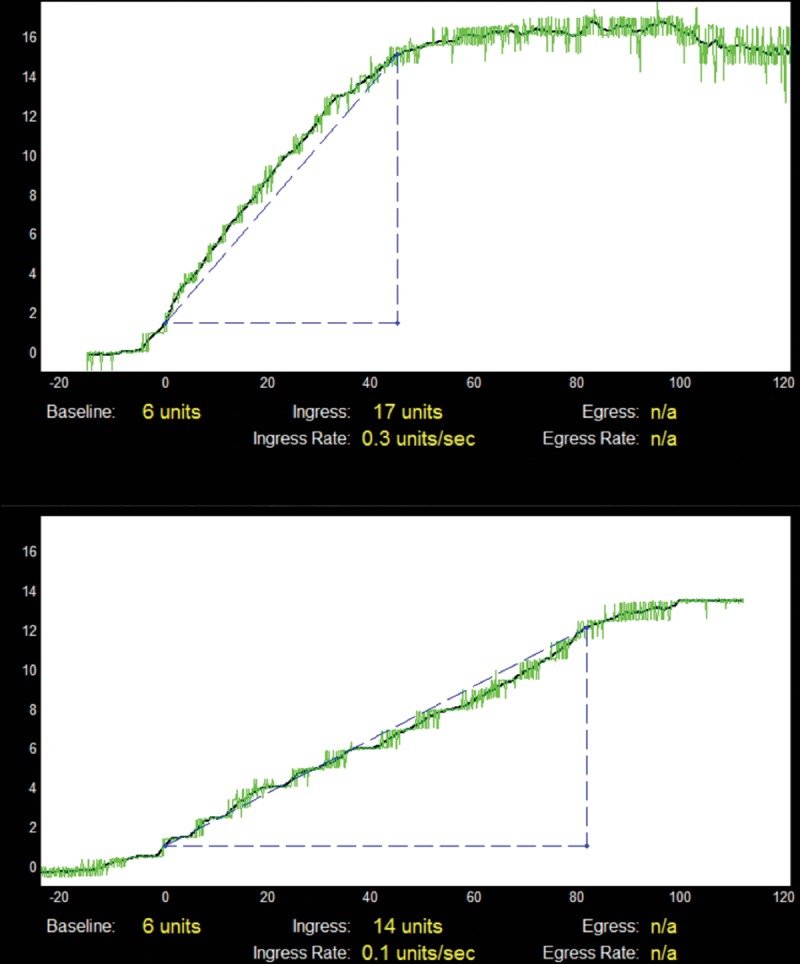
Change in SPY with the DCFA clamped. The y axis represents fluorescent units, and the x axis represents time (seconds). This graph was generated by the SPY software. Measuring left great toe perfusion, the top graph shows baseline intensity and time to maximum intensity (Tmax = 42) with no vessels clamped. With the left DCFA clamped, bottom graph reveals increased time to maximum intensity (Tmax = 100), indicating decreased toe perfusion. Slope of line (in blue) indicates ingress rate, calculated to 90% maximum to better approximate rate. Ingress is defined as the rate at which fluorescence intensity increases in the target area being captured by the infrared camera. A steeper ingress rate clinically implies improved perfusion. Single measurements of the DCFA clamped and not clamped were used.