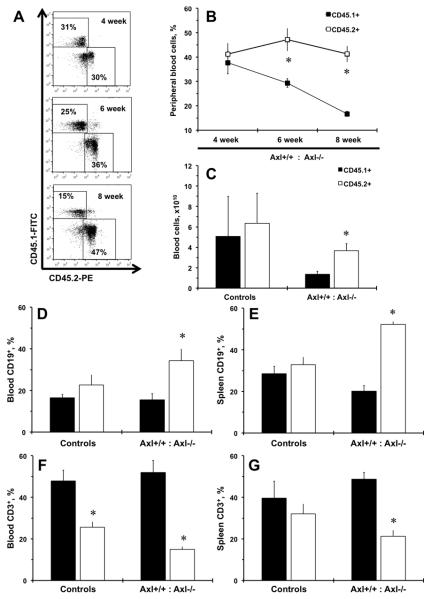
Figure 2. Competitive repopulation of Axl bone marrow cells after bone marrow transplant.
A. Representative flow charts of double stained CD45.1 (Axl+/+) and CD45.2 (Axl−/−) peripheral leukocytes from Axl chimeric mice. B. A time-course of competitive repopulation (CD45.1+ and CD45.2+; 50% and 50%) after 8 weeks of bone marrow transplant (BMT). C. Total numbers of CD45.1+ and CD45.2+ cells in Axl chimeras at 8 weeks after BMT. D. Percentages of CD19+ cells in blood. E. Percentages of CD19+ cells in spleen. F. Percentages of CD3+ cells in blood. G. Percentages of CD3+ cells in spleen. Black bars represent Axl+/+ (CD45.1+) cells. Open bars – Axl−/− (CD45.2+) cells. Values are mean±SEM. *, p<0.05 vs. Axl+/+. Controls, n=4. Axl chimeras, n=10.

