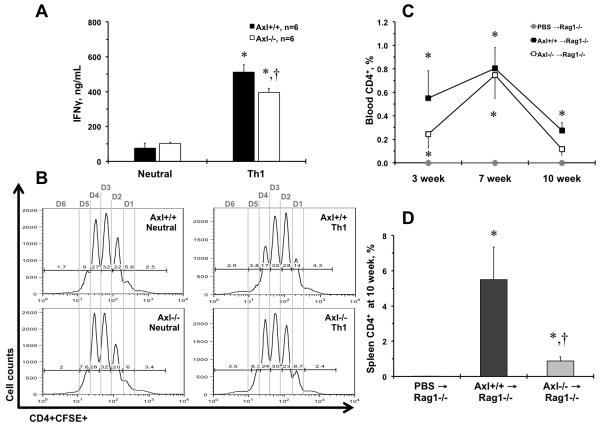
Figure 3. Axl regulates T cell functions.
A. Secretion of interferon gamma (IFN-γ) under Th1 conditions. Black bar represent Axl+/+ cells. Open bar represent Axl−/− cells. *, p<0.05 vs. Neurtal conditions. †, p<0.05 vs. Axl+/+ Th1 cells. n, Number of replicates. B. Representative flow charts of CFSE proliferation of Axl CD4+ T cell in 6 cell divisions (Division 1 – Division 6). n=5. C. A time-course of CD4+ T cell repopulation after adoptive transfers to Rag1−/− mice in blood. Grey circle and grey line show Rag1−/− mice injects with PBS (n=4). Black squares and black line – Axl+/+ CD4+ → Rag1−/− mice (n=6). Open squares and black line – Axl−/− CD4+ → Rag1−/− mice (n=6). D. Percentages of CD4+ T cells in spleen after 10 weeks after adoptive transfer to Rag1−/− mice. Open bar shows PBS → Rag1−/− mice. Dark grey bar – Axl+/+ CD4+ → Rag1−/− mice. Light grey bar – Axl+/+ CD4+ → Rag1−/− mice. Values are mean±SEM. *, p<0.05 vs. PBS → Rag1−/− mice. †, p<0.05 vs. Axl+/+ CD4+ → Rag1−/− mice.

