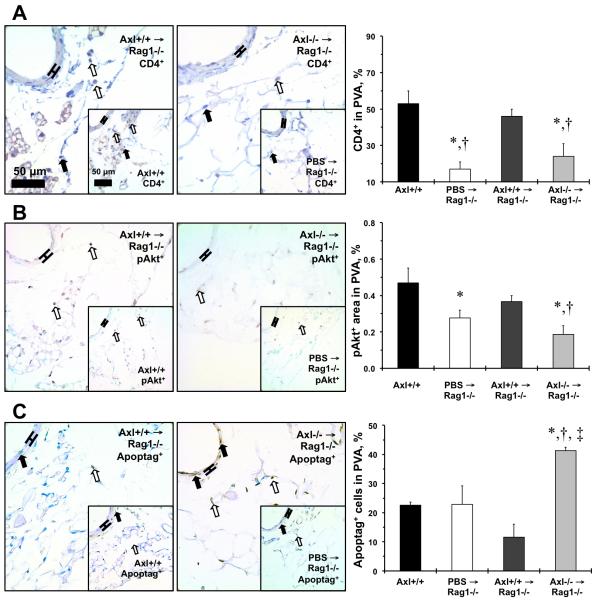
Figure 5. Immunohistochemical evaluation of the arteries from mice after CD4+ T cell repopulation and DOCA- salt hypertension.
A. CD4+ cells and quantification in the perivascular adventitia (PVA) of mesenteric artery. B. p-Akt+ cells and quantification in the PVA of mesenteric artery. C. Apoptag+ cells and quantification in the PVA of mesenteric artery. Black bars show Axl+/+. Open bars – PBS → Rag1−/− mice. Dark grey bars – Axl+/+ CD4+ → Rag1−/− mice. Light grey bars – Axl−/− CD4+ → Rag1−/− mice. Values are mean±SEM. *, p<0.05 vs. Axl+/+. †, p<0.05 vs. PBS → Rag1−/− mice. ‡, p<0.05 vs. Axl+/+ CD4+ → Rag1−/− mice. n=3 per each group.

