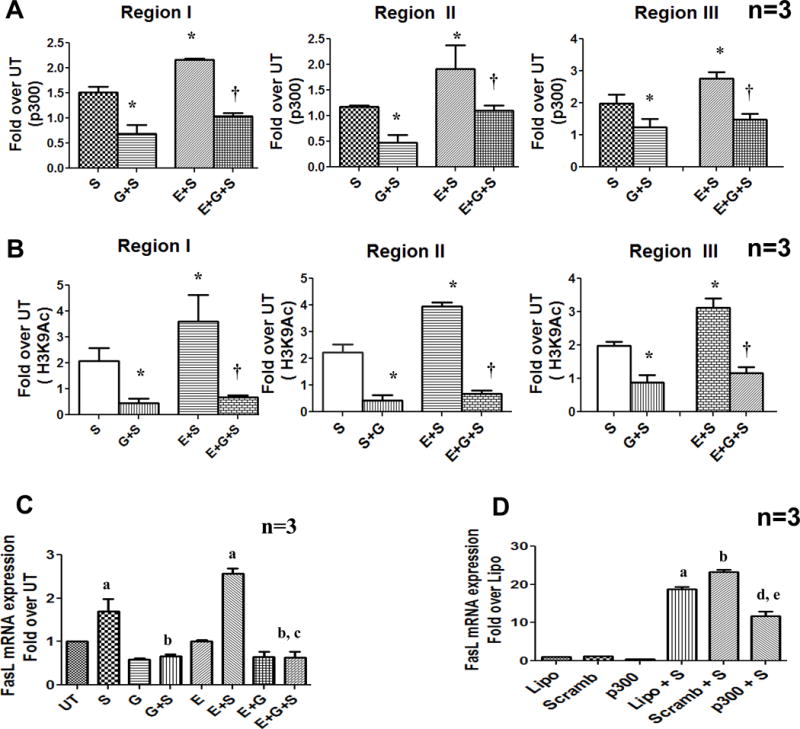
Figure 7. p300 inhibition prevents its promoter recruitment, H3K9 acetylation and FasL mRNA expression in CD4 + T lymphocytes.

Control and ethanol exposed cells were treated as described earlier with p300 HAT inhibitor, Garcinol (10μM) 1 h prior to stimulation (G+S and E+G+S). (A) p300 binding and Histone H3 lysine 9 acetylation (B) at FasL promoter were examined by ChIP qPCR at regions I, II and III. Results are represented as mean ± SE (n=3). Statistical analysis was performed by RMME models, P values: * = p<0.001 compared to S, † = p<0.01 compared to E + S (C) FasL mRNA levels were quantified by real-time PCR in untreated, ethanol and garcinol treated cells after 24h of stimulation. Data are expressed as fold induction over untreated (n=3). a = p < 0.01 compared to UT, b = p < 0.01 compared to S, and c = p < 0.01 compared to E+S. (D) Molt-4 T cells were transfected by electroporation with 150nM scrambled non-specific RNA (Scramb) or p300 specific siRNA (p300) using lipofectamine (Lipo- reagent control). The cells were cultured for 48h and then stimulated with anti-CD3/CD28 (1μg/ml) for 6hr (Lipo+S), (Scramb+S) and (p300+S). FasL mRNA expression was analyzed by RT-PCR. Results are represented as mean ± SE from 3 separate experiments. Statistical analysis was performed by one way ANOVA method. a = p < 0.01 compared to Lipo, b = p < 0.01 compared to Scramb, d = p < 0.01 compared to Lipo+S and e = p < 0.01 compared to Scramb+S
