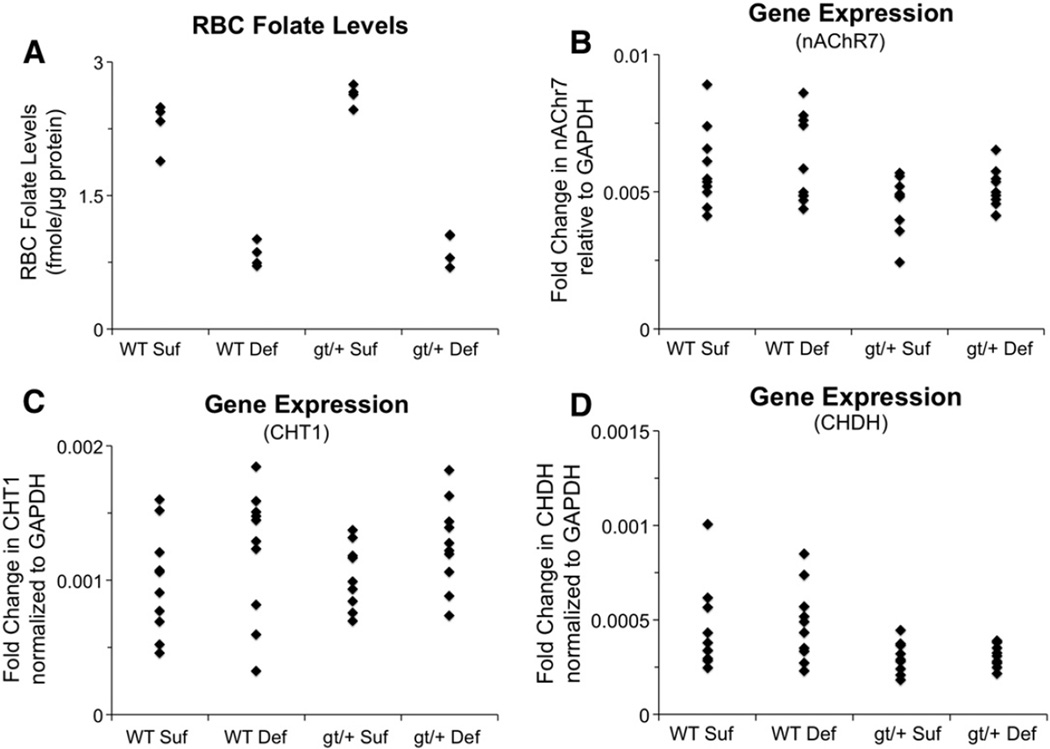
Fig. 6.
Dot plots for red blood cell (RBC) folate levels and cholinergic gene expression data: (A) RBC folate levels normalized to total protein levels, indicating that mice on the Def diet had significantly lower RBC levels than those on the Suf diet (p = 0.0009); (B) fold change in nAChR7 expression levels relative to GAPDH expression, showing significantly reduced nAChR7 expression for the gt/+ mice relative to the WT mice (p = 0.027), although this effect was less pronounced for the gt/+ Def mice; (C) fold change in CHT1 expression levels relative to GAPDH expression, indicating significantly higher expression for mice maintained on the Def diet (Def > Suf, p = 0.040); and (D) fold change in CHDH expression levels relative to GAPDH expression, revealing significantly reduced expression for the gt/+ mice (gt/+ < WT, p = 0.011). Abbreviations: WT Suf: wildtype mice fed a folate sufficient diet; WT Def: wildtype mice fed a folate deficient diet; gt/+ Suf: Mthfd1gt/+ mice fed a folate sufficient diet; gt/+ Def: Mthfd1gt/+ mice fed a folate deficient diet; gt/+: Mthfd1gt/+ mice; WT: wildtype mice; CHDH: choline dehydrogenase, nAChR7: nicotinic acetylcholine receptor alpha 7; CHT1: high affinity choline transporter; GAPDH: glyceraldehyde-3-phosphate dehydrogenase.

