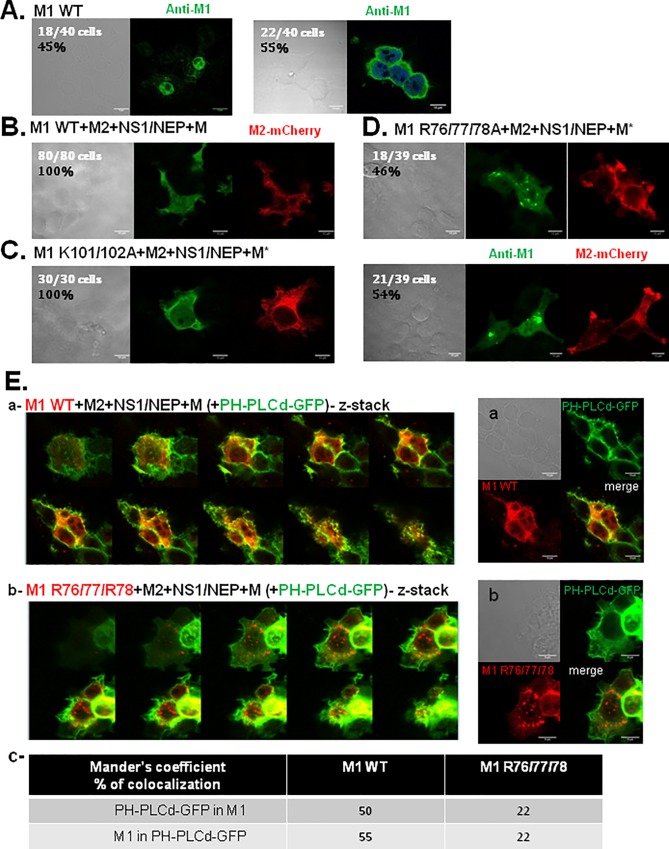
Fig 5. Cellular localization of M1 and its basic mutants using immunofluorescence confocal microscopy.
Immunofluorescence confocal microscopy imaging of HEK 293T cells transfected with pcDNA-M1 (WT or R76/77/78A), pcDNA-M2-mCherry and pHW2000-NS1/NEP, as indicated (A, B, C and D). M1 was detected using a primary anti-M1 antibody and a secondary antibody coupled to Alexa488 (in green), M2-mCherry is shown in red. Transmission images are in grey. Scale bars, 10 μm. (E) Analysis of M1 WT and M1 R76/77/78A localization at the plasma membrane using the PH-PLCdelta-GFP membrane markers. (a) and (b) Immunofluorescence confocal microscopy z-stack images of HEK 293T cells transfected with pcDNA-M1 (WT in (a) and R76/77/78A in (b)), pcDNA-M2, pHW2000-NS1/NEP and M + PH-PLCd-GFP. M1 was detected using a primary anti-M1 antibody coupled to an Alex555 secondary antibody (in red). GFP is in green. Transmission is in grey. Scale bar, 10μm. (c) Co-localization quantification of the M1 signal with PH-PLCd-GFP (Mander’s overlap coefficients).

