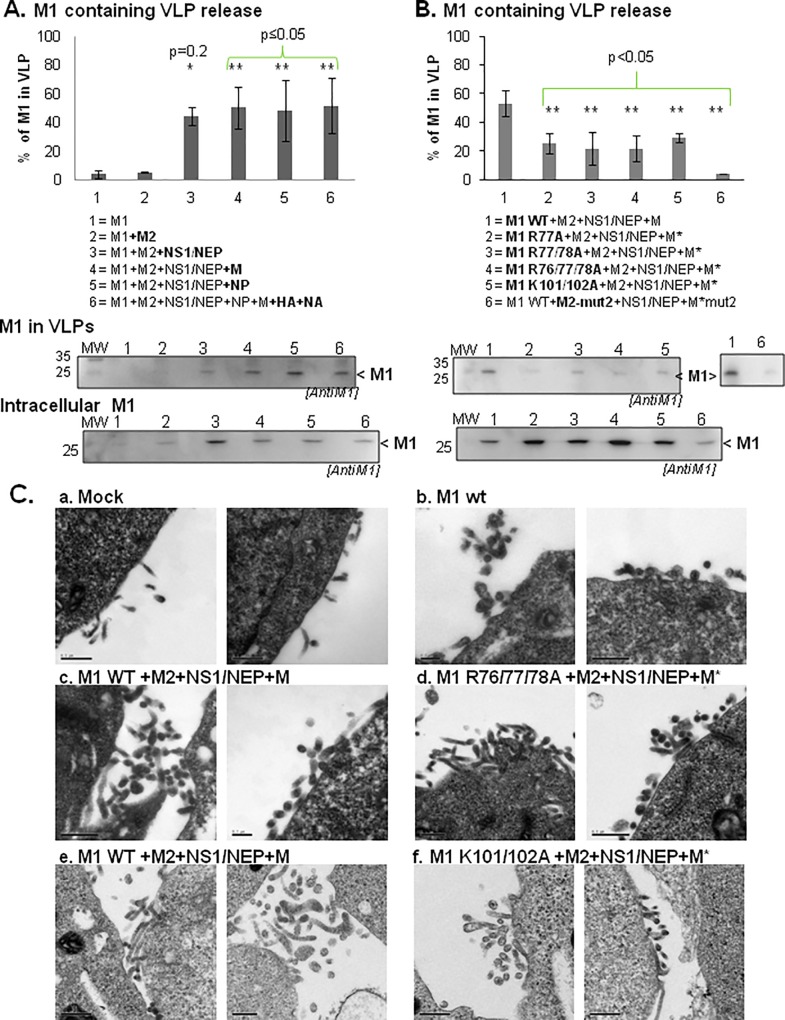
Fig 6. VLP production in the presence of different influenza A(H1N1)pdm09 viral proteins and M1 mutants.
Cell supernatants were centrifuged on a sucrose cushion and VLPs were resuspended in TNE buffer. M1 (intracellular and in VLPs) was detected by western blotting using an anti-M1 antibody. M1 release was calculated using the following formula: % of M1 released = M1 in VLPs / (M1 in VLPs + intracellular M1) and the results are the mean ± standard deviation (error bars) of three independent experiments. Significant differences between condition 2 (M1+M2) in 6A and condition 1 (M1 WT+M2+NS1/NEP+M) in 6B and the other conditions were calculated by using the Student’s t test: *, p = 0.2, ** p ≤0.05. (A) Minimal partners required for the production of M1-containing VLPs. (B) M1-containing VLP production upon expression of M1 WT or mutants. The M2 CT mutant M2-mut2 was used as control. (C) Electron microscopy analysis of influenza A(H1N1)pdm09 VLP production in HEK 293T cells. Cells were transfected with pcDNA empty vector (Mock) or pCDNA3-M1 (WT or mutants), +/- pcDNA-M2, pHW2000-NS and pHW2000-M (M* bearing the indicated M1 mutations), as indicated: Mock (a), M1 WT alone (b), M1+M2+NS1/NEP+M (c and e), M1R76/77/78A+M2+NS1/NEP+M* (d) and M1 K101/102A+M2+NS1/NEP+M* (f). Scale bars: 0.5 μm, except for the left panel in b and the right panel in c where the scale bars represent 0.2 μm. These experiments were done three times independently using new batches of transfected cells.

