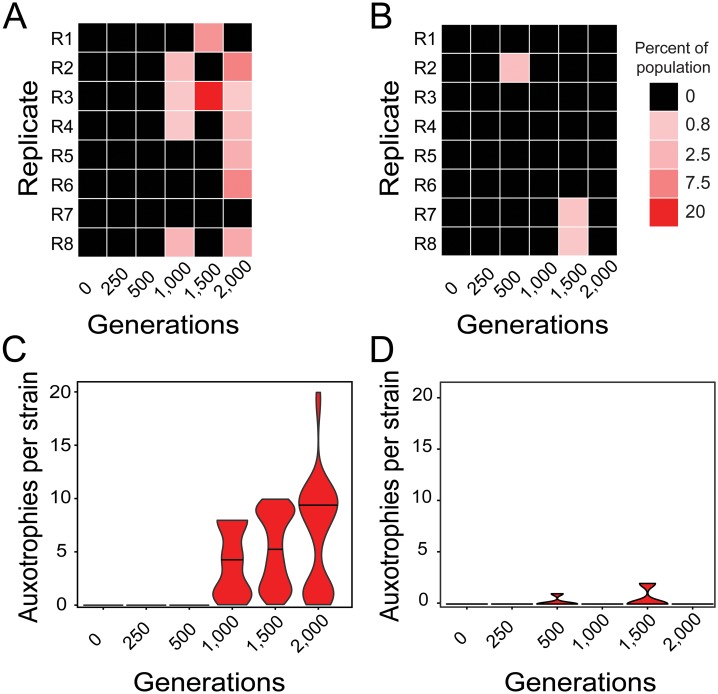
Fig 2. Rapid evolution of amino acid auxotrophies.
(A,B) Heatmaps depict the population-level frequency AA-auxotrophic genotypes reached per 1,000 CFUs analyzed when evolving in (A) the presence or (B) the absence of AAs. Rows represent replicate populations (R1-R8) and columns are different evolutionary time points. Different colors indicate the frequencies of auxotrophic strains detected per population (see legend). (C,D) Distribution of the number of AA auxotrophies identified per auxotrophic strain isolated from (C) the AA regime and (D) the non-AA regime at different evolutionary time points. Violin plots are scaled to the same maximum width and lines within plots indicate the medians of the distributions.

