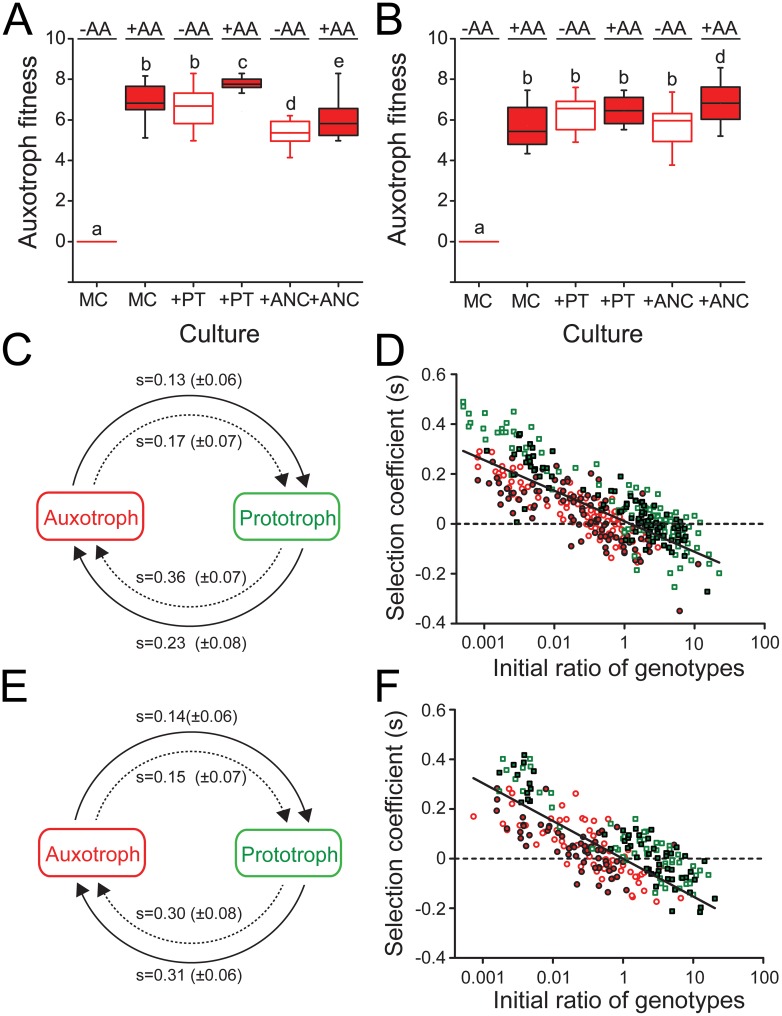
Fig 4. Auxotrophic strains evolved frequency-dependent interactions with coexisting prototrophs.
(A,B) Fitness of auxotrophic strains that have been isolated after (A) 2,000 generations of growth under AA-replete or (B) 1,500 generations of growth under AA-deficient conditions expressed as the Malthusian parameter. Growth was determined in monoculture (MC) or in coculture with either a prototrophic strain isolated from the same time-point and population (+PT) or the evolutionary ancestor (+ANC) in the presence (red boxes) or absence of AAs (empty boxes). Different letters indicate significant differences in the auxotrophs’ fitness (one-way ANOVA followed by a LSD post-hoc test: P<0.05, n = 4 for 6 derived auxotrophic strains for the AA regime and n = 4 for 3 derived auxotrophic strains for the non-AA regime). (C-F) Reciprocal invasion-from-rare experiments show the interaction between coevolved auxotrophic (red) and prototrophic (green) genotypes isolated from (C,D) the AA regime or (E,F) the non-AA regimes is stabilized by negative frequency-dependent selection. Competition experiments between auxotrophic and prototrophic strains were initiated at a ratio of 1:100 or 100:1 and subsequently propagated daily for 5 days (i.e. 75 generations). Selection coefficients (s) were determined at the end of every transfer cycle. (C,E) Arrows point from the initially rare invader to the common type (initial ratio: 1:100) that is being invaded in the presence (solid arrows) or absence (dashed arrows) of AAs. Numbers above arrows are mean selection coefficients (± 95% confidence interval) after the first transfer (i.e. 24 h), which in all cases were significantly larger than zero, indicating a successful invasion (one sample t-test: P<0.05, n = 4 for 6 derived auxotrophic or prototrophic strains for the AA regime and n = 3 for 4 derived auxotrophic or prototrophic strains for the non-AA regime). (D,F) Selection coefficients of the auxotrophic (circles) and prototrophic (squares) genotypes after a transfer as a function of its initial ratio at the onset of every growth cycle. The experiment was performed in both the presence (filled symbols) of absence (open symbols) of AAs and the data of the entire experiment (i.e. 5 d) is plotted cumulatively. The solid line represents the linear regression of s on the ratio of the two genotypes isolated from (D) the AA regime (R2 = 0.19, P<0.001) or (F) the non-AA regime (R2 = 0.41, P<0.001).

