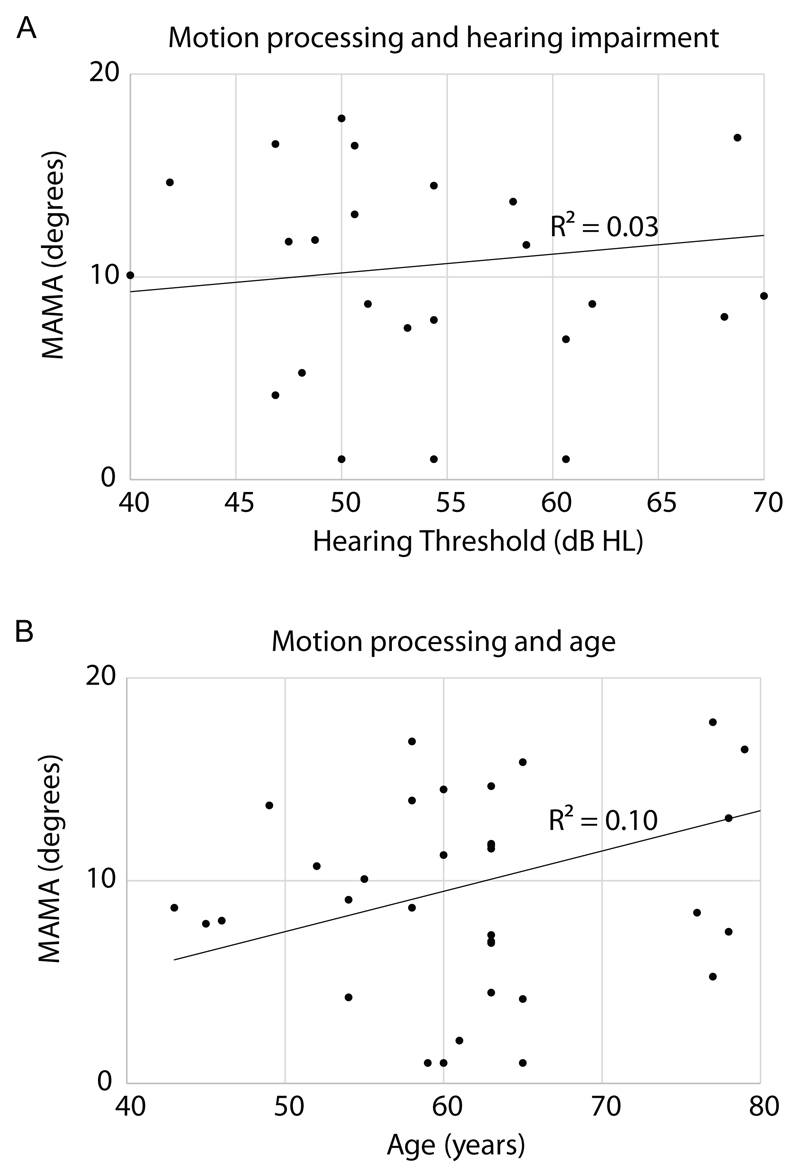
Figure 5.
MAMA as a function of hearing impairment (A) and age (B). Similar to the previous figure, the dots represent individual data points for each hearing impaired listener and the solid lines are a linear fit to the data. No consistent relationship was seen between MAMA and amount of hearing loss (A) or age (B).

