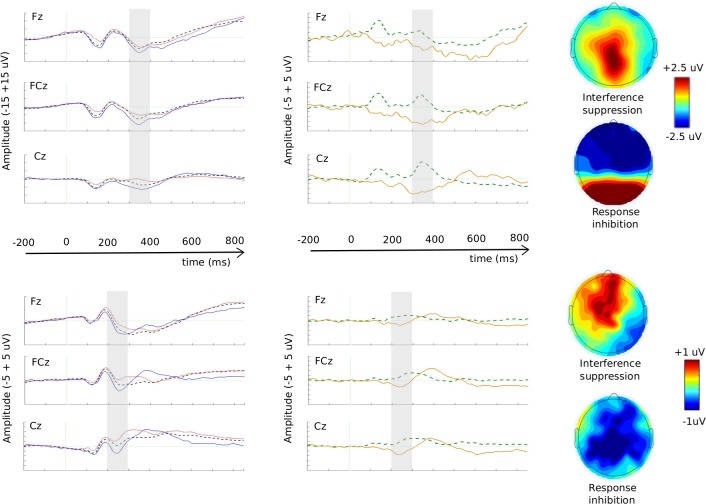
Fig 4. The N2 component.
Stimulus-locked grand average ERP waveforms in response to GC (black dashed line), GI (red dotted line) and NGC (blue solid line) at electrodes Fz, FCz and Cz, for children (A) and adults (D). Grand-averaged difference waveforms computed as GI–GC (green dashed line; interference suppression N2 effect) and NGC–GC (yellow solid line; response inhibition N2 effect) at electrodes Fz, FCz and Cz, in children (B) and adults (E). Note: The window used for N2 analysis in each group is marked by the grey area (300-400ms for the children and 200-300ms for the adults). The topographies represent the difference within each window of analysis for interference suppression (up) and response inhibition (down) in children (C) and adults (F). Please also note that the scale for the ERP waveforms is different between the children and adults’ data; being -15 +15 μV for the former (A) and -5 +5 μV for the latter (D)

