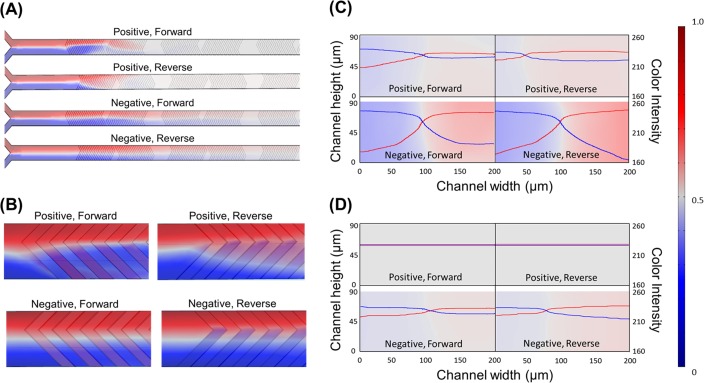
Fig 4. Numerical simulation results of the SHM devices.
Red and blue color indicates fluorescein and DI, respectively. The white color code represents complete mixing. (A) Top view images obtained from the 3D simulation of the SHM up to 2.5 cycles (the width of the microchannels in the images are magnified 2 times for better observation) (B) Top view images of simulated flow at the entrance of the first cycle (C-D) Cross sectional images and color intensity of each fluid in the microchannel (C) After first cycle (D) After third cycle. The color legends present fluorescence dye (red) and DI (blue) concentrations.

