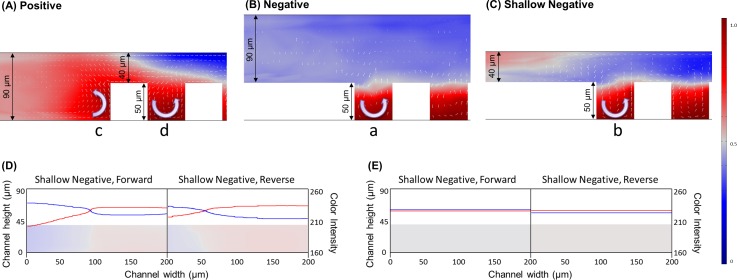
Fig 5. Numerical simulation of the fluid behavior at SHM entrances.
(A) Positive forward (B) Negative forward (C) Shallow negative forward. Arrows indicate relative vorticity of the fluids regarding x and z axis of the channel. (D-E) Cross sectional images and color intensity of each fluid in the microchannel. (D) After first cycle of shallow negative. (E) After third cycle of shallow negative. The color legends present concentrations of fluorescence dye (red) and DI (blue).

