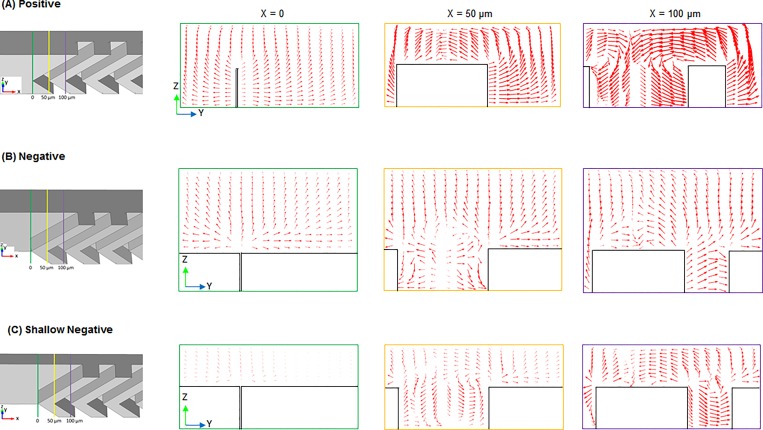
Fig 6. Cross-sectional velocity vector plots at SHM entrances.
(A) Positive forward (B) Negative forward (C) Shallow negative forward. Arrows indicate relative velocity of the fluids regarding y and z axis of the channel. Fluidic velocity in the positive pattern is seven and two times larger than the negative and shallow negative pattern, respectively, when the size of the arrow in simulation is the same due to scale factor difference.

