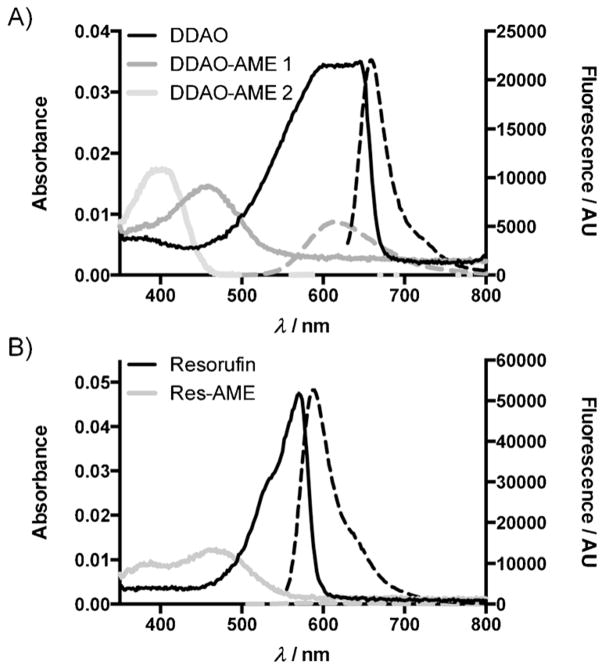
Figure 1.
The absorbance and emission spectra of AM ether fluorogenic probes. The absorbance curves are shown as solid lines, with emission curves shown as dashed lines. Each sample was prepared as 1 μM probe in 10 mM HEPES (pH 7.3). A) Spectra for DDAO (λex = 600 nm), DDAO-AME 1 (λex = 465 nm), and DDAO-AME 2 (nonfluorescent). B) Spectra for resorufin (λex = 525 nm) and Res-AME (λex = 475 nm).

