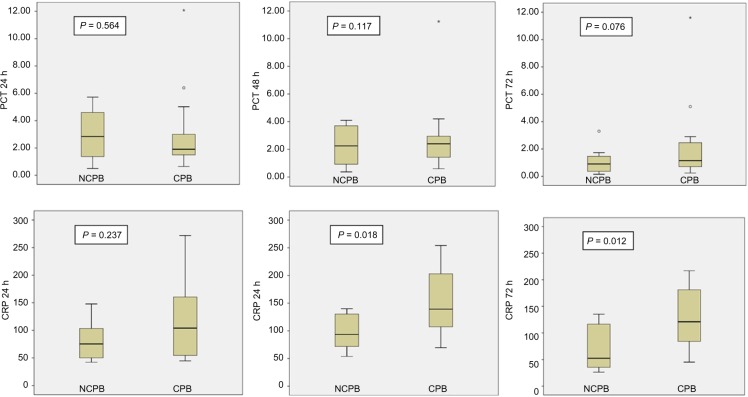
Figure 1.
Comparison of procalcitonin and C-reactive protein levels according to NCPB and CPB groups without sepsis*. Figures show box representing interquartile range, line-subdividing box representing median, and the whisker span extending from the lowest to the highest values, excluding outliers. Outliers are shown ○ as and *.
Abbreviations: CRP, C-reactive protein (mg/L); PCT, procalcitonin (ng/mL).

