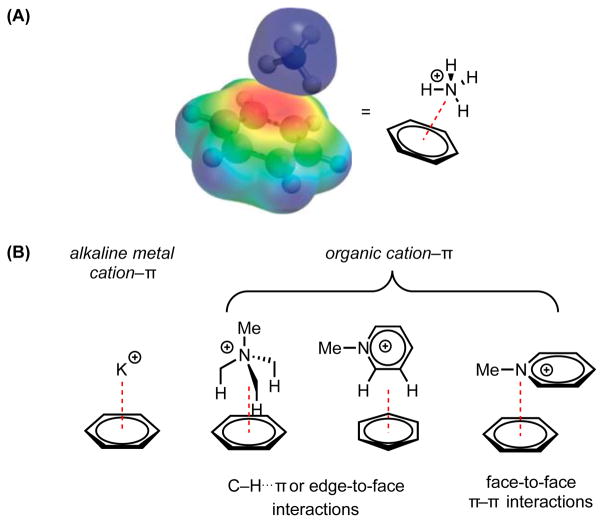
Figure 1.
The cation–π interaction. (A) Molecular electrostatic potential surface (negative potential in red, positive in blue) illustrating the electrostatic basis for a cation–π interaction between benzene and an ammonium cation. Adapted with permission from ref. 1c. Copyright 2013 American Chemical Society. (B) Examples of different interaction modes available to small-molecule systems engaging in cation–π interactions (red dotted lines).

