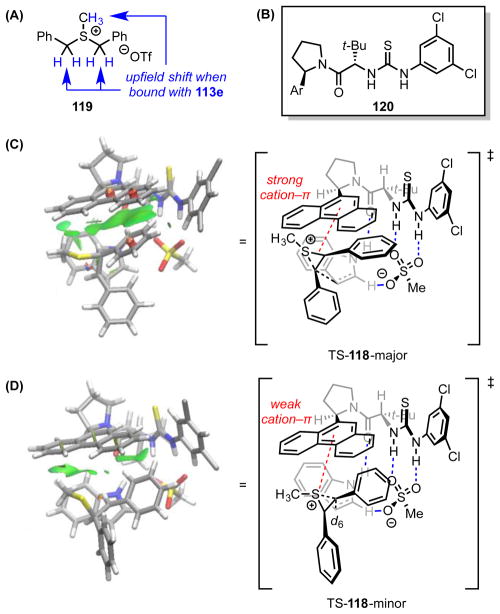
Figure 13.
(A) The benzylic proton 1H NMR resonances of episulfonium model 119 undergo a significant upfield shift upon complexation with 113e. (B) Simplified catalysts used to approximate 113 in computational analyses. The lowest-energy computed transition structures (M05-2X/6-31G(d)) with catalyst 120e en route to the (C) major and (D) minor enantiomers of product 118. Noncovalent interactions (green surfaces) were visualized with NCIPLOT. Red dotted lines represent cation–π interactions. Blue dotted lines represent hydrogen bonds. Black or grey dotted lines indicate forming or breaking bonds. Adapted from ref. 100.

