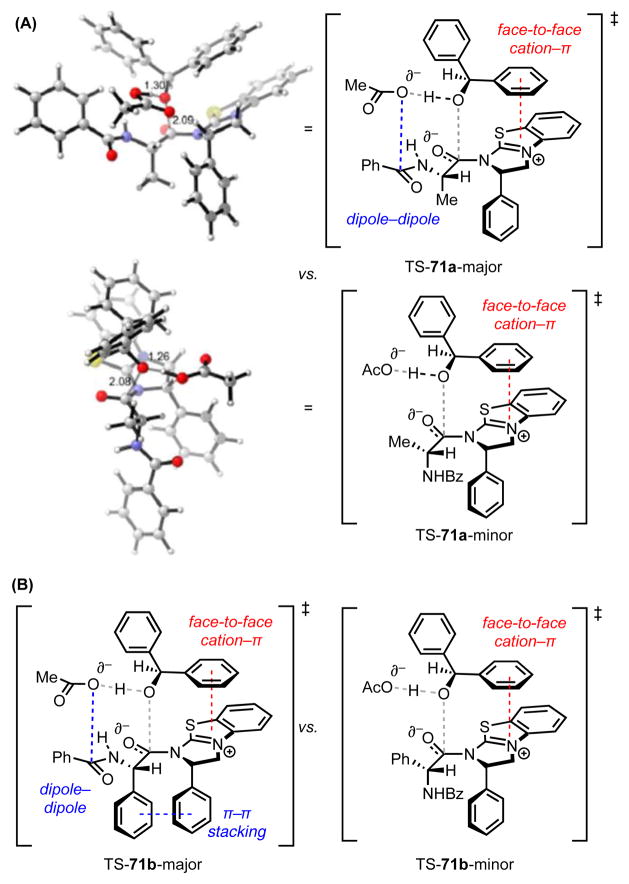
Figure 6.
(A) Lowest energy computed transition structures for acylation of the fast-reacting (S)-enantiomer (top) and slow-reacting (R)-enantiomer (bottom) of substrate 70a and (B) substrate 70b (M06-2X/6-311+G(d,p)/SMD(CHCl3)//M06-2X/6-31G(d)/SMD(CHCl3)). Red dotted lines represent cation–π interactions; blue dotted lines represent other noncovalent interactions. Grey and black dotted lines indicate breaking or forming bonds. Key distances shown in Å. Adapted with permission from ref. 67. Copyright 2012 American Chemical Society.

