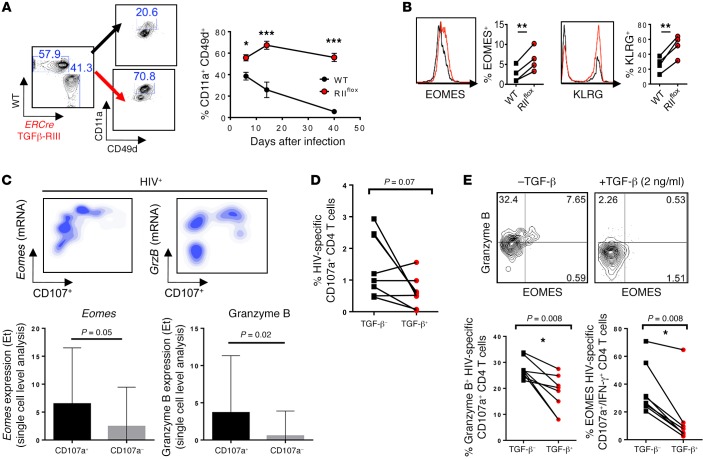
Figure 7. TGF-β suppression of EOMES-driven responses was common to CD4 T cells from mice infected with MCMV and HIV-infected patients.
(A and B) Mixed chimeras with 1:1 ratio of WT (CD45.1, black) and ERCre+ Tgfbr2flox (CD45.2, red) bone marrow reconstituted prior to TGFβ-RII deletion, were infected with 2 × 10⁴ PFU MCMV i.p. (A) Proportion of CD4 T cells expressing activation markers CD11a and CD49d over time after gating on congenic marker, is shown for postinfection day 14. (B) Overlays of EOMES and KLRG expression in activated CD4 T cells. (C) Upper panels show density plots of mRNA expression level vs. CD107 protein and quantification of Eomes and GrzB transcripts in CD107+ vs. CD107– responding CD4 T cells. Lower panels show single-cell analysis of Eomes and granzyme B mRNA expression levels in HIV-specific IFN-γ+CD107a+ CD4 T cells after a 5-hour Gag peptide stimulation using Biomark Fluidigm analysis. The transcript expression threshold (Et) was defined as the qPCR cycle number above background at which the transcript was detected. (D and E) Gag-responsive HIV-specific CD4 T cells were isolated and cultured for 5 days in the presence or absence of TGF-β and restimulated with GAG peptides in the presence of CD28/CD49d, and monensin for percentage of CD107+ CD4 T cells (D) and eomesodermin and granzyme B expression in HIV-specific CD107+ CD4 T cells (E). (A and B) Representative data from 2 independent experiments, with n = 4 or 5 mice/group. (C–E) Representative data from n = 10 HIV+ treatment-naive subjects. Two-way ANOVA (A), paired t test (B–E), *P < 0.05, **P < 0.005, ***P < 0.0005.

