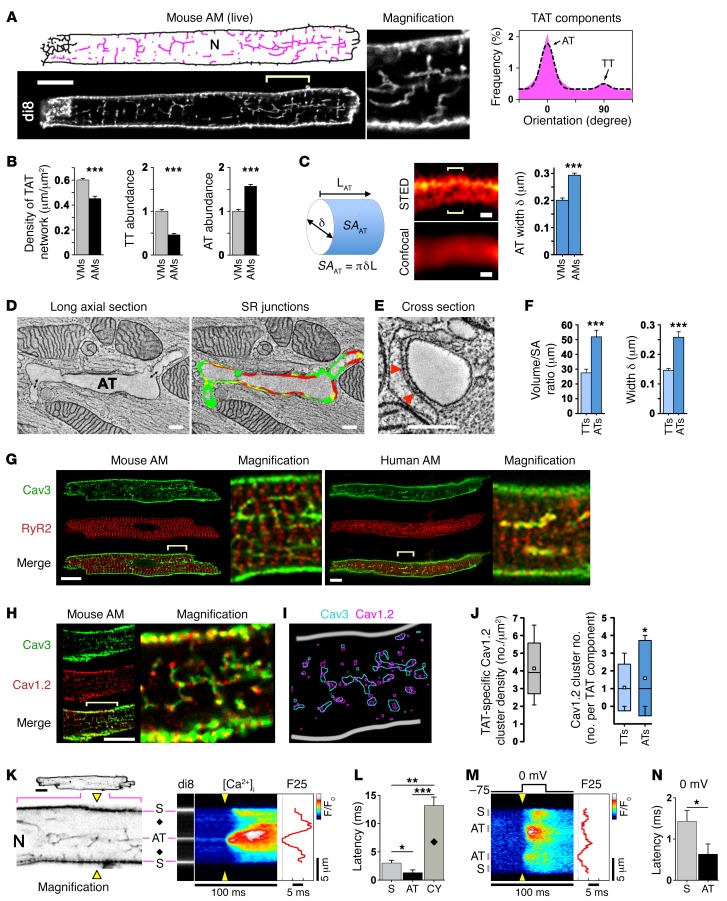
Figure 1. Abundant AT structures rapidly activate Ca2+ release.
(A) Confocal live imaging of di-8-ANEPPS–stained (di8) TAT structures visualized as skeletons (pink). N, nucleus. Scale bar: 10 μm. TAT component orientations (histogram) and Gaussian fitting show abundant AT (0°) versus sparse TT (90°) components (binning ± 20°). n = 36 AMs. (B) Comparison of ventricular versus atrial TAT network length normalized to cell area; TT and AT component abundance. n = 36 AMs and 25 VMs. (C) Illustration conceptualizing AT width (δ) measurements and calculated surface area (SA). L, length. AT width was determined from local STED signal distributions of optical cross sections (brackets) and is summarized in the bar graph. Scale bars: 200 nm. n = 27 VMs, 30 AMs. (D) Double-headed arrows indicate potential AT-TT connections; ET images and segmentation of longitudinally sectioned and (E) cross-sectioned AT structures. Scale bars: 200 nm. Color legend – red, AT-SR junctions ≤ 15nm in gap width and containing RyR2 densities; yellow, AT-SR junctions ≤ 20nm in gap width but lacking RyR2 densities; green, membrane area with no apparent junctions. AT-TT junction; for color rendering, see Supplemental Figure 4. Arrows indicate exemplary electron densities compatible with RyR2 channels. (F) Bar graphs comparing TT versus AT volume/surface area ratio and width. n = 13 TTs, 23 ATs. Data are representative of 3 hearts. (G and H) Confocal images of Cav3-, RyR2-, and Cav1.2-coimmunostained mouse and human AMs. Robust Cav3-labeled AT structures in human and mouse AMs. Scale bars: 10 μm, magnification ×4. Yellow brackets indicate regions magnified. (I) Image segmentation. (J) Box plots summarizing TAT-specific Cav1.2 cluster density; component-specific Cav1.2 cluster numbers. White boxes indicate the mean; boxes represent the 50th percentile and lower and upper SD, and whiskers represent the 10th and 90th percentiles. n = 17 AMs. (K) Confocal visualization (negative contrast) of AT structures for transversal line scanning (yellow triangles) of intracellular Ca2+ (fluo-4) magnification ×4: field potential–evoked Ca2+ transient activated via AT and subsurface (S) structures; black diamonds, off-membrane CY; F25, Ca2+ signal onset at 25% signal amplitude; F/F0, Normalized fluorescence intensity ratio indicated by look-up-table; N, nucleus. (L) Relative latency of early Ca2+ signal upstroke (dF/dt) for the indicated locations. Data are representative of 19 AMs. (M) Voltage-clamped AMs (1 mM EGTA) during Ca2+ transient activation. F25, Ca2+ signal onset during –75 to 0 mV depolarization. (N) Latency difference of Ca2+ signal upstroke (dF/dt). n = 15 AMs. *P < 0.05, **P < 0.01, and ***P < 0.001, by Student’s t test (A–F, K–N) and Mann-Whitney U test (J).

