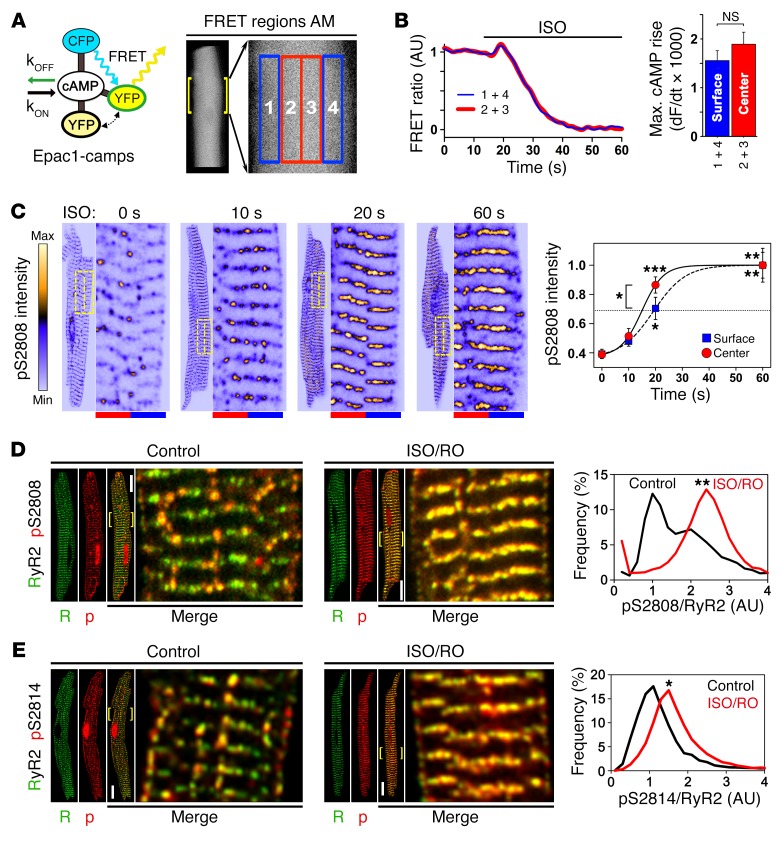
Figure 5. In situ regulation of atrial RyR2 cluster phosphorylation.
(A) Illustration showing cAMP-dependent responses of Epac1-camps, a ubiquitous cytosolic FRET sensor, during live-cell measurements. In AMs, signals from 4 transversally distributed FRET regions were sampled and signal averaged pairwise for corresponding central (2 + 3, red) versus surface (1 + 4, blue) regions. kOFF, cAMP dissociation constant; kON, cAMP association constant; CFP, cyan fluorescent protein; YFP, yellow fluorescent protein. (B) FRET ratio traces show the same spatiotemporal AM response to 0.1 μM ISO stimulation during increasing intracellular cAMP generation. Bar graph comparing the maximal rate of cAMP rise shows no significant difference between AM center and surface. NS, by Student’s t test. n = 12 AMs. (C) Confocal time series showing progressive RyR2-S2808 cluster phosphorylation following up to 60 seconds of β-adrenergic stimulation (1 μM ISO). RyR2-pS2808 cluster signals were averaged from 10 striations (see magnifications) through equal-sized central (red) and surface (blue) regions indicated by dashed-line yellow boxes. RyR2-pS2808 intensity plot shows progressive cluster phosphorylation, which was significantly faster for central AM regions after a 20-second ISO stimulation. Each time point represents 7 AM experiments. *P < 0.05, **P < 0.01, and ***P < 0.001, by ANOVA. (D and E) Maximal stimulation by combined ISO/RO (1 μM/10 μM) treatment converted lowphos into highphos RyR2 clusters. (D) Histogram shows bimodal pS2808-RyR2 cluster signal pattern under control conditions (black trace), resulting in a profound change of the lowphos RyR2 cluster signals by ISO/RO treatment: 1 major highphos peak, consistent with complete lowphos cluster conversion (red trace). **P < 0.01, by Mann-Whitney U test. Dara are representative of 13 control-treated and 18 ISO/RO-treated AMs. Scale bars: 10 μM, magnification ×4. (E) Images and histogram showing a distinct pS2814/RyR2 cluster phosphorylation shift after ISO/RO stimulation (note: control data are the same as in Figure 3F). *P < 0.05, by Mann-Whitney U test. Data are representative of 19 control-treated and 12 ISO/RO-treated AMs. Scale bars: 10 μM, magnification ×4.

