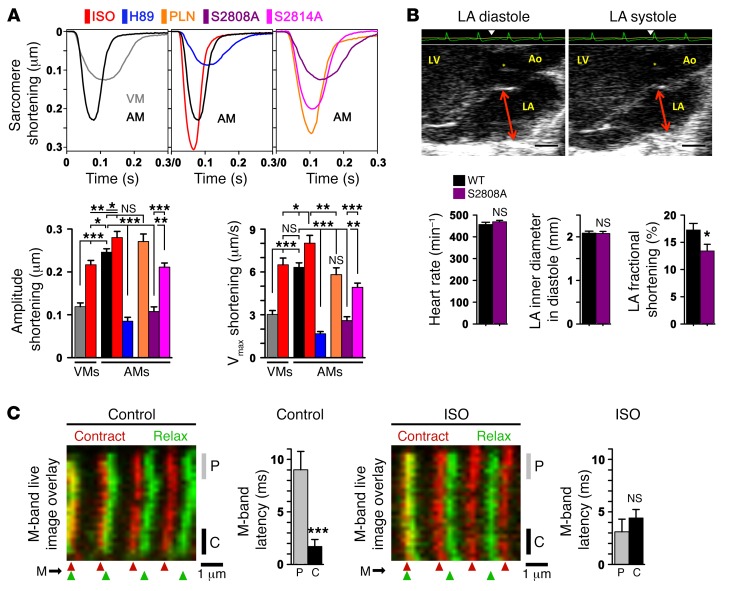
Figure 7. Catecholaminergic RyR2 cluster recruitment regulates sarcomere shortening and atrial contractility.
(A) Representative AM sarcomere length traces during unloaded shortening; colors at top indicate the different conditions; VMs were used as a reference. The same WT AM control trace (black) is presented twice for comparison. WT AMs were treated with ISO (1 μM) or H89 (1 μM) and compared with RyR2-S2808A+/+-knockin, RyR2-S2814A+/+–knockin, or PLN-KO (Pln–/–) strains. Bar graphs summarizing maximal sarcomere shortening amplitude and velocity (Vmax) for the indicated conditions. Data are representative of 29 VMs and 59 AM WT controls; ISO, 13 AMs; H89, 33 AMs; S2808A, 44 AMs; S2814A, 36 AMs; and PLN, 17 AMs. *P < 0.05, **P < 0.01, and ***P < 0.001, by Student’s t test. (B) LA echocardiogram showing normal LA diameters in diastole versus systole (arrows) but significantly decreased fractional shortening in RyR2-S2808A+/+ mice. An electrocardiogram (ECG) recording (green) was used to time maximal atrial relaxation and contraction (triangles). n = 18 WT mice and 19 RyR2-S2808A mice+⁄+. *P < 0.05, by Student’s t test. Ao, aorta; asterisk indicates the aortic valve. Scale bars: 1 mm. (C) Confocal live-image overlays were aligned to the left-most striation as indicated. The flexible nature of the sarcomeric M-bands was visualized during AM contraction (red) versus relaxation (green) using knockin mice expressing C-terminal–tagged titin-EGFP and peripheral versus central readouts as indicated. Bar graphs summarize the relative M-band latency between peripheral (P) versus central (C) M-band regions in control- versus ISO-treated (1 μM) cells. n = 29 control and 24 ISO AMs. ***P < 0.001, by Student’s t test.

